C# and VB Basics
All examples assume the target framework .NET 8(net8.0) unless otherwise stated in a particular section.
Variables
Variables are the basic working blocks in code. You use variables to hold values. There are several different variable types but in this lesson we will cover only four of them.
To declare a variable you use the language keyword “Dim” used with a name and “As”. So if you want a string called “Hello World” named TestVariable you would declare it like this.
Dim TestVariable As String = "Hello World"
string TestVariable = "Hello World";
This example declares a variable and assigns a value at the same time. However you can declare a variable without assigning value. The value can always be assigned later. A good general rule is only declare a variable when it is ready to be used (assigned) when possible.
- Integer - are like whole numbers but can contain negatives
- String - contain multiple characters
- Decimal - numbers with decimals
- Boolean - is true or false
Integers
Integers are like whole numbers but can contain negatives. So they have negatives, zero, or positives.
For example -5, -4, -3, -2, -1, 0, 1, 2, 3, 4, 5 are all integer values.
To declare an integer you can do this.
Dim i As Integer
int i;
This example creates a new variable of type Integer name i. It does not assign any value to i. To assign a value to i you can do it like this.
i=1
i=1;
Now the value of i is 1.
i=2
i=2;
Now the value of i is 2.
Strings
Strings can hold any value. They can have letters, numbers, special characters. They can be long or short
To declare a string you can do this.
Dim s As String
string s;
This example creates an empty string called s. This string has no value
To assign the value “hello world” to the variable s we would do.
s = "hello world"
s = "hello world";
The value of the variable can be reassigned at any time so if we want to change the value to “purple monkey dishwasher” just do the same as above put with the new string.
s = "purple monkey dishwasher"
s = "purple monkey dishwasher";
If we want to see the value of a variable printed to the console we can write.
System.Console.WriteLine("The value of s is: " & s)
System.Console.WriteLine($"The value of s is: {s}");
We see here that s is value is append to the string “The value of s is: “ and then printed to the console as “The value of s is: purple monkey dishwasher”. You can append any string to any other string at any time using the & symbol.
StringBuilder
If you are appending to a string again and again or changing it value over and over again this can become very slow. String operations like this can be speed up using the StringBuilder class.
To use a string builder you need to initialize System.Text.StringBuilder.
Dim builder As New System.Text.StringBuilder
builder.Append("Hello World ")
builder.Append("Peter.  ")
builder.Append("Have a good day.")

System.Console.WriteLine(builder.ToString)
var builder = new System.Text.StringBuilder();
builder.Append("Hello World ");
builder.Append("Peter.  ");
builder.Append("Have a good day.");

System.Console.WriteLine(builder.ToString());
This will print “Hello World Peter. Have a good day.”.
What this does is keep adding to a buffer and when you call the ToString method it finally creates a string. This is much faster then concatenating the string together like the following.
System.Console.WriteLine("Hello World " & "Peter. " & "Have a good day.")
System.Console.WriteLine("Hello World " + "Peter. " + "Have a good day.");
This example probably is not faster since it is so tiny but if you did this with 100 000 strings the string builder would be much faster.
Decimals
Decimals are used when you need numeric values that contain decimals places. It is essential if you are doing financial calculations that you use decimals and no other data type. Do not use doubles.
For example -5.32, -4.76, -3.7654, -2.1, -1.343, 0.13, 1.786555, 2.2, 3.765, 4.22, 5.3446 are all decimal values.
To declare a decimal you can do this.
Dim d As Decimal = 4.444D
decimal d = 4.444m;
This example creates a new variable of type Decimal with the name d and a value of 4.444d
To assign a new value to d you can do it like this.
d=5.437D
d = 5.437m;
Now the value of d is 5.437.
d=2.55
d = 2.55m;
Now the value of d is 2.55. As shown above variables in function can always be reassigned new values
Booleans
Booleans are variables that can be either True or False. That is all they hold. Booleans default to false.
To declare a boolean you can do this.
Dim b As Boolean = False
bool b = false;
This example creates a new variable of type Boolean named b. It does not assign any value to b. To assign a value to b you can do it like this.
b=True
b=true;
Now the value of b is True.
b=False
b=false;
Now the value of b is False.
There is no other value that a boolean can hold. If you do not set a value a boolean will default to False.
Chars
Chars are variables that can hold one character and only one character. It can be any character available but only one character at a time.
To declare a char you do this.
Dim c As Char
char c;
This example creates a new variable of type Char named c. It does not assign any value to c. To assign a value to c you can do it like this.
c="A"c
c='A';
Now the value of c is A.
c="~"c
c='~';
Now the value of c is ~.
As is written above any character can be held in a char variable but only one character at a time. Like any other variable type you can print the variable to the console using like this.
System.Console.WriteLine(c)
System.Console.WriteLine(c);
DateTime
DateTime variables can hold a date and time value. If you just want a date you can also use Date instead of DateTime.
To declare a DateTime you do this.
Dim t As DateTime
DateTime t;
This example creates a new variable of type DateTime named t. It does not assign any value to t. To assign a value to t you can do it like this.
t = DateTime.Now
t = DateTime.Now;
This assigns the current date and time to the variable t.
If you want to assign a specific date such as 01 may 2012, do it like this.
t = New DateTime(2012, 5, 1)
t = new DateTime(2012, 5, 1);
Now the date of t would now be 01 May 2012 with a time of 00:00:00.
If you want to print the date to the console you can use several of its functions to print in different formats.
System.Console.WriteLine(t.ToString)
System.Console.WriteLine(t.ToShortDateString)
System.Console.WriteLine(t.ToString());
System.Console.WriteLine(t.ToShortDateString());
There are several other functions that can be looked up and used but generally I find these are the two that I use most often.
Doubles
Doubles are variables that hold numeric values with decimal places. They are similar to the decimal variable type but are less accurate and accumulate rounding errors when calculations are performed.
To declare a double you do this.
Dim d As Double
double d;
This example creates a new variable of type Double named d. It does not assign any value to d. To assign a value to d you can do it like this.
d = 5.555567
d = 5.555567;
Now the value of d is 5.555567.
d = 2.1
d = 2.1;
Now the value of d is 2.1.
Like any other variable type you can print the variable to the console using like this.
System.Console.WriteLine(d)
System.Console.WriteLine(d);
Objects
Objects are a base type that all other objects are derived from. This means that any other variable no matter the type can be assigned to an object.
To declare an object you do this.
Dim o As Object
Object o;
This example creates a new variable of type Object named o. It does not assign any value to o. To assign a value to o you can do it like this.
o = "A"c
o = 'A';
Now the value of o is A. The type is Char stored in the object. If we assign an integer.
o = 120
o = 120;
Now the value of o is 120 and the type of the stored value is an Integer
We can do the same by assigning strings, decimals, doubles, or any other type or object into an object of type Object.
If we print the object when assigned an integer it will print the integer. If we print when it is assigned char it will print the char and so on with the other variable types.
System.Console.WriteLine(o)
System.Console.WriteLine(o);
Generally I suggest avoiding the Object type as it defeats type checking that a compiler does and in my experience causes a lot of run time errors. The runtime errors are caused when code attempts to do an operation on the object that is not supported by the stored variable type. If we declare the type we want to use in code the compiler can do all the checks that are needed when the program is complied.
Objects
VB and c# have built in types such as int, bool, string, and others. Now it is time to create types that is more specific to your application
For example if you are writing an application about tv channels/stations you probably do not want to use strings and integers. It will be easier to think about stations and channels. In VB, c#, and other object oriented languages we can define our own types and use them just like the built in types.
To use a class you must declare one as you would any other variable type. I will be using the word class and object interchangeably.
For example you declare an integer like this
Dim i As Integer = 0
int i = 0;
Below we create our own data type using the keyword Class. The best way to use a class is to think of it as an object. For the purpose of this example our object is going to be a tv show. Tv shows have many different aspects to them so we create an object that represent them.
Included in the class are a new class property (ShowName) as Public and a Private variable (_showName) that the property works with. Never declare a class variable as public. Always use a property or a function. I will not explain it here but I do encourage you to read some books on object oriented design.
Private variables are accessible from any function in the class but cannot be accessed from other classes.
Public Class TVShow
    Public Sub New()
        ' constructor
    End Sub

    Private _showName As String
    ' Public properties can be accessed from any function inside the
    ' class as well as other classes
    Public Property ShowName() As String
        Get
            ' Inside the get part the private variable is returned.
            ' You can do anything you want here such as data validation
            ' before returning the data if you need or want.
            Return _showName
        End Get
        Set(ByVal value As String)
            ' Inside the set part the private variable is set.
            ' You can do anything you want here such as data validation
            ' before the data is set.
            If value.Trim = "" Then
                Throw New Exception("ShowName cannot be empty")
            End If
            _showName = value
        End Set
    End Property

    ' The above property is long form.  A shorter form can be done as seen below
    Public ReadOnly Property ShowLength As Integer
    Public ReadOnly Property Summary As String
    Public ReadOnly Property Rating As Decimal
    Public ReadOnly Property Episode As String
End Class
public class TVShow
{
    public TVShow()
    {
    }

    private string _showName;
    // Public properties can be accessed from any function inside the
    // class as well as other classes
    public string ShowName
    {
        get
        {
            // Inside the get part the private variable is returned.
            // You can do anything you want here such as data validation
            // before returning the data if you need or want.
            return _showName;
        }
        set
        {
            // Inside the set part the private variable is set.
            // You can do anything you want here such as data validation
            // before the data is set.
            if (value.Trim() == "")
                throw new Exception("ShowName cannot be empty");
            _showName = value;
        }
    }

    // The above property is long form.  A shorter form can be done as seen below
    public int ShowLength {get; init;}
    public string Summary {get; init;}
    public decimal Rating {get; init;}
    public string Episode {get; init;}
}
You create a new instance of a class the same way you would with an Integer. You create a new instance like this
Dim starTrek As New TVShow With {
    .ShowName = "Star Trek"
    .ShowLength = 1380
    .Summary = "Teleport Disaster"
    .Rating = 5.0D
    .Episode = "1x12"
}
var starTrek = new TVShow() {
    ShowName = "Star Trek",
    ShowLength = 1380,
    Summary = "Teleport Disaster",
    Rating = 5.0m,
    Episode = "1x12"
};
If you want a second object you just declare another one.
Dim dexter As New TVShow With {
    .ShowName = "Dexter"
    .ShowLength = 1380
    .Summary = "Dexter kills again."
    .Rating = 4.8D
    .Episode = "10x01"
}
var dexter = new TVShow() {
    ShowName = "Dexter",
    ShowLength = 1380,
    Summary = "Dexter kills again.",
    Rating = 4.8D,
    Episode = "10x01"
};
Methods
Methods, also known as functions, are used to break code apartment into smaller chunks. Functions should do one task and do it well. Functions can be called again and again. They are used to keep duplicate code from building up. This makes things easier to understand. They can be chained/used together to perform complex tasks.
Functions can return a value or return no value. In vb functions that return a value use the key word Function and ones that do not return a value use the keyword Sub. In c# functions that return a value have a type such as a built-in type or object and functions that do not return a value use the keyword *void.
public class TVShow
{
    public string ShowName {get; init;}
    public int ShowLength {get; init;}
    public string Summary {get; init;}
    public decimal Rating {get; init;}
    public string Episode {get; init;}

    // includeSummary is a method parameter
    public void PrettyPrint(bool includeSummary){
        if (includeSummary)
        {
            Console.WriteLine($"{ShowName} {Episode} {Rating} {ShowLength} {Summary}");
        }
        else
        {
            Console.WriteLine($"{ShowName} {Episode} {Rating} {ShowLength}");
        }
    }

    public bool IsGoodRating(){
        return Rating >= 3.0m;
    }
}

var dexter = new TVShow() {
    ShowName = "Dexter",
    ShowLength = 1380,
    Summary = "Dexter kills again.",
    Rating = 4.8D,
    Episode = "10x01"
};

dexter.PrettyPrint(includeSummary: true);

if(dexter.IsGoodRatting()){
    Console.WriteLine("Let's watch this episode.");
}
Method and function parameters are passed by reference for objects and by value for simple types.
Interfaces
Interfaces - define behavior for multiple types. An interface contains definitions for a group of related functionalities that a non-abstract class or a struct must implement.
Interfaces in c# and vb is a way to specify what an object implements. It provides the ability to have different concrete class implementations and choose different ones at runtime.
A good example for further self study is the Microsoft ILogger.
We will build upon the TVShows class. We will define an interface. We will include a new property ParentalGuide.
Much of this will not make sense until the IOC and Depednacy injection sections later in this guide.
The following code example defines an interface named TVShow. It is not necessary or necessarily recommended to prepend the name with an I but it is very common to see such interfaces in the c# and vb world. In code bases that do prepend an I the name would be ITVShow. The following code examples will not follow that pattern.
Imagine we have a large program involving tv shows. We could pass around the instances of TVShow but that will make our program brittle if and when we need to make changes.
public interface TVShow
{
    string ShowName {get; init;}
    int ShowLength {get; init;}
    string Summary {get; init;}
    decimal Rating {get; init;}
    string Episode {get; init;}
    string ParentalGuide {get; init;}

    void PrettyPrint(bool includeSummary);
    bool IsGoodRating();
}
An interface cannot be initialized. If we were to try to do so it would be a compile time error.
// Will not compile.
var inst = new TVShow();
Below a new class called ComedyShow implments TVShow. Notice line one with : TVShow after the class name. ComedyShow is a type of TVShow. Next notice that AdventureShow also implements TVShow.
public class ComedyShow : TVShow
{
    public string ShowName {get; init;}
    public int ShowLength {get; init;}
    public string Summary {get; init;}
    public decimal Rating {get; init;}
    public string Episode {get; init;}
    public string ParentalGuide {get; init;}

    // includeSummary is a method parameter
    public void PrettyPrint(bool includeSummary){
        if (includeSummary)
        {
            Console.WriteLine($"Comedy: {ShowName} {Episode} {Rating} {ShowLength} {Summary}");
        }
        else
        {
            Console.WriteLine($"Comedy: {ShowName} {Episode} {Rating} {ShowLength}");
        }
    }

    public bool IsGoodRating(){
        return Rating >= 3.0m;
    }
}

public class AdventureShow : TVShow
{
    public string ShowName {get; init;}
    public int ShowLength {get; init;}
    public string Summary {get; init;}
    public decimal Rating {get; init;}
    public string Episode {get; init;}
    public string ParentalGuide {get; init;}

    // includeSummary is a method parameter
    public void PrettyPrint(bool includeSummary){
        if (includeSummary)
        {
            Console.WriteLine($"Adventure: {ShowName} {Episode} {Rating} {ShowLength} {Summary}");
        }
        else
        {
            Console.WriteLine($"Adventure: {ShowName} {Episode} {Rating} {ShowLength}");
        }
    }

    public bool IsGoodRating(){
        return Rating >= 3.5m;
    }
}
Reviewing the code we can see that while both the ComedyShow and AdventureShow classes are similar but they have different implementations of PrettyPrint and IsGoodRating. In addtion to different internals to the interface methods they each could have different private helper methods or even other public methods.
Lets assume our application permits users to enter tv show information and as part of that entry they can add the show as commedy or an adventure show. Let’s store that information in a list. Notice how InsertShow has a parameter TVShow but lower in the code when calling the method all objects that implement the TVShow interface can be added and worked on.
public static class Shows
{
    static List<TVShow> _tvShows = new List<TVShow>();

    public static void InsertShow(TVShow show)
    {
        _tvShows.Add(show);
    }

    public static void PrintShows()
    {
        foreach (var show in _tvShows)
        {
            show.PrettyPrint(includeSummary: true);
        }
    }
}

public static void Main()
{
    Shows.InsertShow(new ComedyShow() {
        ShowName = "Friends",
        ShowLength = 1380,
        Summary = "The friends get coffee.",
        Rating = 4.8m,
        Episode = "4x05",
        ParentalGuide = "PG13"
    });
    Shows.InsertShow(new AdventureShow() {
        ShowName = "Rick and morty",
        ShowLength = 760,
        Summary = "A quick 20 minute in and out adventure.",
        Rating = 3.8m,
        Episode = "3x14",
        ParentalGuide = "18A"
    });

    Shows.PrintShows();
}
The output is
Comedy: Friends 4x05 4.8 1380 The friends get coffee. Adventure: Rick and morty 3x14 3.8 760 A quick 20 minute in and out adventure.
For simplicity the example above is using a static Shows class. I almost always recommend against using static classes. I’ve shown their use in the above example as it is simple but in general I have found their use often coincides with global variables and long term they cause a maintenance quagmire. Static classes and variables have their place but try to avoid them.
Note: Read up about base classes and abstract bases classes as they are an alternative to using interfaces. Read about SOLID development.
Async/Await
Asynchronous programming . The core of async programming is the Task and Task
objects, which model asynchronous operations. They are supported by the async and await keywords. The model is fairly simple in most cases: For I/O-bound code, you await an operation that returns a Task or Task inside of an async method. For CPU-bound code, you await an operation that is started on a background thread with the Task.Run method.
Async and await provides a way for more efficient use of threads. When a task is run it can be awaited later while doing more work while waiting.
Simple async/await example:
Private Async Function LoadPreviousSettings() As Task
	Await Task.Delay(5000)
End Function

Dim loadTask As Task = LoadPreviousSettings()

' Do some other crazy stuff

Await loadTask
private async Task LoadPreviousSettings()
{
	await Task.Delay(5000);
}

var loadTask = LoadPreviousSettings();

// Do some other crazy stuff

await loadTask
The async and await pattern makes asynchronous programming easier and feels more like sequential development. Good places for async/await is I/O bound work such as when making network calls. Much of the time is spent waiting for a response and the thread could be doing other work while waiting. Network calls such as database connections, commands, updates, inserts, selects, deletes, and stored procedure and functions executions should be run with async and await pattern.
Another place async/await should be used is when making http calls. The example below demonstrates using async/await when using HttpClient to download a web site front page. In an asp.net core application IHttpClientFactory should be used to create an HttpClient.
using System;
using System.Collections.Generic;
using System.Diagnostics;
using System.Threading.Tasks;
using System.Net.Http;

public static async Task Main()
{
    // normally disposable objects should be disposed.
    // HttpClient is a special case and its norm is
    // that it should not be exposed until the program terminates
	using var client = new HttpClient();
    // add all tasks to a list and later await them.
    var tasks = new List<Task<string>>();
     Stopwatch stopWatch = new Stopwatch();
    stopWatch.Start();
    for(int i=0; i<9; i++)
    {
        var instDownloader = new Downloader();
        tasks.Add(instDownloader.DownloadSiteAsync(client, "https://majorsilence.com"));
    }
    Console.WriteLine("majorsilence.com is being downloaded 10 times.  Waiting...");
    foreach(var t in tasks)
    {
        string html = await t;
        Console.WriteLine(html.Substring(0, 100));
    }
    stopWatch.Stop();
    TimeSpan ts = stopWatch.Elapsed;
    Console.WriteLine($"Code Downloaded in {ts.Milliseconds} Milliseconds");

    // sequential async calls
    Console.WriteLine("start sequential async calls to download majorsilence.com.  Waiting...");
    stopWatch.Start();
    for(int i=0; i<9; i++)
    {
        var instDownloader = new Downloader();
        string html = await instDownloader.DownloadSiteAsync(client, "https://majorsilence.com");
        Console.WriteLine(html.Substring(0, 100));
    }
    stopWatch.Stop();
    TimeSpan ts2 = stopWatch.Elapsed;
    Console.WriteLine($"Sequential Code Downloaded in {ts2.Milliseconds} Milliseconds");
}

public class Downloader{
    public async Task<string> DownloadSiteAsync(HttpClient httpClient,
        string url,
        System.Threading.CancellationToken cancellationToken = default(System.Threading.CancellationToken))
    {
        var request = new HttpRequestMessage()
            {
                Method = HttpMethod.Get,
                RequestUri = new Uri(url)
            };

        // proceed past user agent sniffing
        request.Headers.Add("User-Agent", "Mozilla/5.0 (X11; CrOS x86_64 14541.0.0) AppleWebKit/537.36 (KHTML, like Gecko) Chrome/111.0.0.0 Safari/537.36");

        HttpResponseMessage response = await httpClient.SendAsync(request, cancellationToken).ConfigureAwait(false);

        response.EnsureSuccessStatusCode();
        return await response.Content.ReadAsStringAsync().ConfigureAwait(false);
    }
}
Threads
Dot net provides the Thread class.
Here is an example that starts a background tasks and checks every 500 millisecond if it is complete using the IsAlive property. If the background thread is still working it continues its work inside a while loop.
using System;
using System.Collections.Generic;
using System.Threading;
using System.Threading.Tasks;

public class Program
{
    public static async Task Main()
    {
        var t = new Thread(ThreadMethod);
        t.Start();

        Console.WriteLine("Do other things while waiting for the background thread to finish");

        while(t.IsAlive){
            Console.WriteLine("Alive");
            await Task.Delay(500);
        }

        Console.WriteLine("job completed");
    }

    static void ThreadMethod(){
        Console.WriteLine("The code in this method is running in its own thread.");
        Console.WriteLine("Sleep the thread 5000 milliseconds to demonstrate the main thread keeps working.");
        Thread.Sleep(5000);
    }
}
This example starts a thread and does no work. The main thread stops work and waits for the background thread to complete using the Join method.
using System;
using System.Collections.Generic;
using System.Threading;
using System.Threading.Tasks;

public class Program
{
    public static async Task Main()
    {
        var t = new Thread(ThreadMethod);
        t.Start();
        Console.WriteLine("Wait for the background thread to complete");
        t.Join();
        Console.WriteLine("job completed");
    }

    static void ThreadMethod(){
        Console.WriteLine("The code in this method is running in its own thread.");
        for(int i = 1; i< 6; i++){
            Console.WriteLine($"background loop count {i}");
            Thread.Sleep(500);
        }
    }
}
Locks
If more then one thread or task is updating a variable you should lock the variable as necessary.
The example below create multiple tasks that all update the same “count” variable. As you can see it locks the variable before updating it.
Dim tasks As New List(of Task)
Dim lockObject As New Object()

int count=0;

For i As Integer = 0 To 10
	tasks.Add(Task.Factory.StartNew(Function()
		For j As Integer = 0 To 999
			SyncLock lockObject
				count = count + 1
			End SyncLock
		Next

	End Function))
Next
using System;
using System.Collections.Generic;
using System.Threading.Tasks;

public class Program
{
    public static async Task Main()
    {
        var tasks = new List<Task>();
		var lockObject = new object();

		int count = 0;
		for (int i = 0; i < 10; i++)
		{
			tasks.Add(Task.Factory.StartNew(() =>
			{
				for (int j = 0; j <= 999; j++)
				{
					lock (lockObject)
                    {
						count = count + 1;
					}
				}
			}));
		}

		foreach(var t in tasks)
		{
			await t;
		}

		Console.WriteLine(count);
    }
}
Winforms
IOC
Repository Pattern
Use the repository pattern to separate your business and data access layers. Makes it easy to test your business and data layer code separately.
There are different ways to do this. Here are a couple ways.
Use a base abstract class that is passed a connection
using System;
using System.Data;
using System.Data.SQLite;
using System.Threading.Tasks;

namespace MajorSilence.DataAccess
{
    public abstract class BaseRepo
    {
        private readonly string cnStr;

        protected BaseRepo(string cnStr)
        {
            this.cnStr = cnStr;
        }

        protected T WithConnection<T>(Func<IDbConnection, T> sqlTransaction)
        {
            using (var connection = new SQLiteConnection(cnStr))
            {
                connection.Open();
                return sqlTransaction(connection);
            }
        }

        protected void WithConnection(Action<IDbConnection> sqlTransaction)
        {
            using (var connection = new SQLiteConnection(cnStr))
            {
                connection.Open();
                sqlTransaction(connection);
            }
        }

        protected async Task<T> WithConnectionAsync<T>(Func<IDbConnection, Task<T>> sqlTransaction)
        {
            using (var connection = new SQLiteConnection(cnStr))
            {
                await connection.OpenAsync();
                return await sqlTransaction(connection);
            }
        }

        protected async Task WithConnectionAsync<T>(Func<IDbConnection, Task> sqlTransaction)
        {
            using (var connection = new SQLiteConnection(cnStr))
            {
                await connection.OpenAsync();
                await sqlTransaction(connection);
            }
        }
    }
}
And here is the repo class
using System;
using System.Linq;
using Dapper;

namespace MajorSilence.DataAccess
{
    public interface ITestRepo
    {
        string GetName();
        void InsertData(string name);
    }

    public class TestRepo : BaseRepo, ITestRepo
    {
        public TestRepo(string cnStr) : base(cnStr) { }

        public string GetName()
        {
            return this.WithConnection(cn =>
            {
                return cn.Query<string>("SELECT Name From TheTable LIMIT 1;").FirstOrDefault();
            });
        }

        public void InsertData(string name)
        {
            this.WithConnection(cn =>
            {
                cn.Execute("INSERT INTO TheTable (Name) VALUES (@Name);",
                    new { Name = name });
            });
        }
    }
}
No base abstract. Let individual repository classes do as they please
I generally prefer this way. It is simple.
using System.Data.SQLite;
using System.Linq;
using Dapper;

namespace MajorSilence.DataAccess
{

    public class TestRepoNobase : ITestRepo
    {
        readonly string cnStr;
        public TestRepoNobase(string cnStr)
        {
            this.cnStr = cnStr;
        }

        public string GetName()
        {
            using (var cn = new SQLiteConnection(cnStr))
            {
                return cn.Query<string>("SELECT Name From TheTable LIMIT 1;").FirstOrDefault();
            };
        }

        public void InsertData(string name)
        {
            using (var cn = new SQLiteConnection(cnStr))
            {
                cn.Execute("INSERT INTO TheTable (Name) VALUES (@Name);",
                    new { Name = name });
            };
        }
    }
}
Do something with the repository classes
A business class
using System;
namespace MajorSilence.BusinessStuff
{
    public class TestStuff
    {
        readonly DataAccess.ITestRepo repo;
        public TestStuff(DataAccess.ITestRepo repo)
        {
            this.repo = repo;
        }

        public void DoStuff()
        {
            repo.InsertData("The Name");
            string name = repo.GetName();

            // Do stuff with the name
        }
    }
}
Combine everything. Manually initialize our two repository classes and initialize two copies of our TestStuff class. Our TestStuff never knows what or where the actual data layer is.
TestStuff is now easily tested with tools such as as moq.
using System;

namespace MajorSilence.TestStuff
{
    class Program
    {
        static void Main(string[] args)
        {

            // Our repository layer that will talk to the data source.
            // This could be inject with a dependency injection framework
            var repo = new MajorSilence.DataAccess.TestRepo("Data Source=:memory:;Version=3;New=True;");
            var repo2 = new MajorSilence.DataAccess.TestRepoNobase("Data Source=:memory:;Version=3;New=True;");


            // Our business class.  Takes an interface and does not care
            // what the actual data source is.
            var inst = new MajorSilence.BusinessStuff.TestStuff(repo);
            inst.DoStuff();

            var inst2 = new MajorSilence.BusinessStuff.TestStuff(repo2);
            inst2.DoStuff();

        }
    }
}
Events
Custom Event and Event Handlers
Use built in EventHandler
public class TheExample
{
    public event System.EventHandler DoSomething;

    public void TheTest(){
        // option 1 to raise event
        this.DoSomething?.Invoke(this, new System.EventArgs());

        // option 2 to raise event
        if (DoSomething != null)
        {
            DoSomething(this, new System.EventArgs());
        }
    }
}
Use custom delegate as event hander
public class TheExample
{
    public delegate void MyCustomEventHandler(object sender, System.EventArgs e);
    public event MyCustomEventHandler DoSomething;

    public void TheTest(){
        // option 1 to raise event
        this.DoSomething?.Invoke(this, new System.EventArgs());

        // option 2 to raise event
        if (DoSomething != null)
        {
            DoSomething(this, new System.EventArgs());
        }
    }
}
Subscribe to the event
// subscribe using lamba expression

var x = new TheExample();

x.DoSomething += (s,e) => {
    Console.WriteLine("hi, the event has been raised");
};
x.TheTest
VB example of basic custom events
Public Class TheExample
    Public Delegate Sub MyCustomEventHandler(ByVal sender As Object, ByVal e As System.EventArgs)
    Public Shared Event MyCustomEventHandler As DoSomething

    Public Sub TheTest
        RaiseEvent DoSomething(Me, New EventArgs())
    End Sub
End Class
Subscribe to the event
dim x As New TheExample
AddHandler x.DoSomething, AddressOf
x.TheTest()

RemoveHandler x.DoSomething, AddressOf EventCallback

Sub EventCallback(ByVal sender As Object, ByVal e As System.EventArgs)
    Console.WriteLine("Hi, the event has been raised")
End sub
Create a custom event
Setup a new custom event class inheriting from EventArgs and setup a new delegate.
public delegate void MyCustomEventHandler(object sender, MyCustomEvent e);

public class MyCustomEvent : System.EventArgs
{
        private string _msg;
        private float _value;

    public MyCustomEvent(string m)
    {
        _msg = m;
        _value = 0;
    }

    public MyCustomEvent(float v)
    {
        _msg = "";
        _value = v;
    }

    public string Message
    {
        get { return _msg; }
    }

    public float Value
    {
        get { return _value; }
    }
}
Use the custom event
public event MyCustomEventHandler DoSomething;

this.DoSomething?.Invoke(this, new MyCustomEvent(123.95f));
Nuget
Generally using nuget is very simple. Using Visual Studio right click your solution or project and select “Add Nuget Package”. Find your package and add it. It is auto added. Any time you now clone your project on a new computer the first time you build your project it will restore your nuget references.
Create a NuGet Package
Given a .csproj or .vbproj file with a PropertyGroup like the following, add the GeneratePackageOnBuild, PackageProjectUrl, Description, Authors, RepositoryUrl, PackageLicenseExpression, Version.
  <PropertyGroup>
    <TargetFrameworks>netstandard2.0;net8.0</TargetFrameworks>
  </PropertyGroup>
PropertyGroup that generates a nuget package on build and fills in many useful details.
  <PropertyGroup>
    <TargetFrameworks>netstandard2.0;net8.0</TargetFrameworks>
    <GeneratePackageOnBuild>true</GeneratePackageOnBuild>
    <PackageProjectUrl>https://PLACEHOLDER</PackageProjectUrl>
    <Description>PLACEHOLDER</Description>
    <Authors>PLACEHOLDER</Authors>
    <RepositoryUrl>https://PLACEHOLDER</RepositoryUrl>
    <PackageLicenseExpression>MIT</PackageLicenseExpression>
    <Version>1.0.1</Version>
  </PropertyGroup>
Add NuGet source
The following command will add a nuget source to your computer other than the default. This is good for self hosted nuget servers. Use –store-password-in-clear-text if a mac or linux workstation is being used.
dotnet nuget add source "https://your.source.url/v3/index.json" -n [Feed Name] -u YourUserName -p YourPassword --store-password-in-clear-text
Check if NuGet Source already Exists
The following powershell script will check if a nuget source already exists on your computer.
dotnet nuget list source
Start fresh with just nuget.org
dotnet new nugetconfig
Testing and Coverage
NUnit and Coverlet
NUnit is a fine testing framework for c#, vb and other .net based languages.
The nuget packages NUnit must be referenced for base NUnit support in a test project and NunitXml.TestLogger should be installed for integration with the visual studio test tools and command line dotnet test and dotnet vstest. For integration within visual studio and rider Microsoft.NET.Test.Sdk should also be added to the test project. coverlet.collector is used to generate the code coverage report. Note, for large solutions and projects coverlet and add a considerable overhead.
dotnet add package NUnit
dotnet add package NunitXml.TestLogger
dotnet add package Microsoft.NET.Test.Sdk
dotnet add package coverlet.collector
To demonstrate the the nunit testing framework we will work with a contrived example. The test class will test a modified threaded lock example from above.
Within the test class ComplexAdditionTests the code will confirm that the calculation works. This is helpful if a developer ever changes the CalculateWithLock method and breaks it. The test will fail and the developer will know that the change causes problems. The test will test the class ComplexAddition.
using System;
using System.Collections.Generic;
using System.Threading.Tasks;
using NUnit.Framework;

[TestFixture]
public class ComplexAdditionTests
{
    public async Task CalculationsCalculatesTest()
    {
        var complexAdds = new ComplexAddition();
        const int expectedResults =
        int actualResult = complexAdds.CalculateWithLock(10, 999);

        //
        Assert.That(actualResults, Is.EqualTo(expectedResults));
    }
}

public class ComplexAddition
{
    public async Task<int> CalculateWithLock(int outerLimit=10, int innerLimit=999)
    {
        var tasks = new List<Task>();
		var lockObject = new object();

		int count = 0;
		for (int i = 0; i < outLimit; i++)
		{
			tasks.Add(Task.Factory.StartNew(() =>
			{
				for (int j = 0; j <= innerLimit; j++)
				{
					lock (lockObject)
                    {
						count = count + 1;
					}
				}
			}));
		}

		foreach(var t in tasks)
		{
			await t;
		}
    }
}
The tests can be run from within visual studios test explorer or from the command line with either dotnet test.
dotnet test
To test and collect coverage data run dotnet test with collector arguments.
dotnet test -c Release YourSolutionFile.sln --collect:"XPlat Code Coverage" --logger:"nunit"
Passing extra args example with exclude by file.
dotnet test -c Release YourSolutionFile.sln --collect:"XPlat Code Coverage" --logger:"nunit" -- DataCollectionRunSettings.DataCollectors.DataCollector.Configuration.ExcludeByFile='**/File1ToIgnore.cs,**/File2ToIgnore.cs'
Other test frameworks
Unit test frameworks:
- xUnit
- MSTest
Acceptance testing framework
BDD (Behavior-driven development) testing
In Memory Work Queue
Task Queue
Thread Queue
Crystal Reports
Examples to use crystal reports from c#. Crystal reports for .net currently only support running on .net framework 4.8 and older. If reports need to be generated with .net core or .net 6 or newer see the CrystalCmd Server and Client section.
Make sure you have the crystal reports runtime installed. It can be downloaded from https://wiki.scn.sap.com/wiki/display/BOBJ/Crystal+Reports%2C+Developer+for+Visual+Studio+Downloads.
All examples below require references for CrystalDecisions.CrystalReports.Engine and CrystalDecisions.Shared to be added to your project.
Ensure the CrystalReports Version and PublicKey token match the installed version of Cyrstal Reports.
<ItemGroup>
    <Reference Include="CrystalDecisions.Windows.Forms, Version=13.0.4000.0, Culture=neutral, PublicKeyToken=692fbea5521e1304, processorArchitecture=MSIL">
        <HintPath>C:\Windows\Microsoft.NET\assembly\GAC_MSIL\CrystalDecisions.Windows.Forms\v4.0_13.0.4000.0__692fbea5521e1304\CrystalDecisions.Windows.Forms.dll</HintPath>
    </Reference>
    <Reference Include="CrystalDecisions.CrystalReports.Engine, Version=13.0.4000.0, Culture=neutral, PublicKeyToken=692fbea5521e1304, processorArchitecture=MSIL">
        <HintPath>C:\Windows\Microsoft.NET\assembly\GAC_MSIL\CrystalDecisions.CrystalReports.Engine\v4.0_13.0.4000.0__692fbea5521e1304\CrystalDecisions.CrystalReports.Engine.dll</HintPath>
    </Reference>
    <Reference Include="CrystalDecisions.Shared, Version=13.0.4000.0, Culture=neutral, PublicKeyToken=692fbea5521e1304, processorArchitecture=MSIL">
        <HintPath>C:\Windows\Microsoft.NET\assembly\GAC_MSIL\CrystalDecisions.Shared\v4.0_13.0.4000.0__692fbea5521e1304\CrystalDecisions.Shared.dll</HintPath>
    </Reference>
</ItemGroup>
Set data using DataTables
Example initializing a report and passing in a DataTable.
using CrystalDecisions.CrystalReports.Engine;
using CrystalDecisions.Shared;

// Pass a DataTable to a crystal report table
public static SetData(string crystalTemplateFilePath,
    string pdfFilename, DataSet val)
{
    using (var rpt = new ReportDocument())
    {
        rpt.Load(crystalTemplateFilePath);

        rpt.Database.Tables["tableName"].SetDataSource(val);
    }
}

// Pass any generic IEnumerable data to a crystal report DataTable
public static SetData(string crystalTemplateFilePath,
    IEnumerable<T> val)
{
    using (var rpt = new ReportDocument())
    {
        rpt.Load(crystalTemplateFilePath);

        var dt = ConvertGenericListToDatatable(val);
        rpt.Database.Tables[tableName].SetDataSource(val);
    }
}

// Found somewhere on the internet.  I know longer remember where.
public static DataTable ConvertGenericListToDatatable<T>(IEnumerable<T> dataLst)
{
    DataTable dt = new DataTable();

    foreach (var info in dataLst.FirstOrDefault().GetType().GetProperties())
    {
        dt.Columns.Add(info.Name, info.PropertyType);
    }

    foreach (var tp in dataLst)
    {
        DataRow row = dt.NewRow();
        foreach (var info in typeof(T).GetProperties())
        {
            if (info.Name == "Item") continue;
            row[info.Name] = info.GetValue(tp, null) == null ? DBNull.Value : info.GetValue(tp, null);
        }
        dt.Rows.Add(row);
    }
    dt.AcceptChanges();
    return dt;
}
Set report parameters
Set report parameters from code.
using CrystalDecisions.CrystalReports.Engine;
using CrystalDecisions.Shared;

public static void SetParameterValueName(string crystalTemplateFilePath, object val)
{
    using (var rpt = new ReportDocument())
    {
        rpt.Load(crystalTemplateFilePath);

        string name = "ParameterName";
        if (rpt.ParameterFields[name] != null)
        {
            this.MyReportDoc.SetParameterValue(name, val);
        }
    }
}
Move report objects
Example moving an object.
using CrystalDecisions.CrystalReports.Engine;
using CrystalDecisions.Shared;

public static MoveObject(string crystalTemplateFilePath)
{
    using (var rpt = new ReportDocument())
    {
        rpt.Load(crystalTemplateFilePath);

        rpt.ReportDefinition.ReportObjects["objectName"].Left = 15;
        rpt.ReportDefinition.ReportObjects["objectName"].Top = 15;
    }
}
Export to pdf or other file type
Load a report and export it to pdf. You can pass in data or set other properties before the export.
using CrystalDecisions.CrystalReports.Engine;
using CrystalDecisions.Shared;

public static ExportPdf(string crystalTemplateFilePath,
    string pdfFilename)
{
    using (var rpt = new ReportDocument())
    {
        rpt.Load(crystalTemplateFilePath);

        var exp = ExportFormatType.PortableDocFormat;
        rpt.ExportToDisk(exp, pdfFilename);
    }
}
CrystalCmd Server and Client
crystalcmd is a:
Java and c# program to load json files into crystal reports and produce PDFs.
tldr: use crystal reports with dotnet netstandard2.0, net48, net6.0, net8.0, net9.0 on linux, windows, mac, android, and iOS.
To host the cyrstalcmd .net server browse to https://github.com/majorsilence/CrystalCmd/tree/main/dotnet and build the Dockerfile.wine and Dockerfile.crystalcmd. If a java server is required use the prebuilt image at https://hub.docker.com/r/majorsilence/crystalcmd. The c# server is recommended.
With a crystalcmd server running crystal report templates and data can be sent to it to produce pdf files. The docker images can run on any system that supports docker such as mac, windows, and linux.
Add the package Majorsilence.CrystalCmd.Client to your project.
To call a crystalcmd server use the nuget package Majorsilence.CrystalCmd.Client.
dotnet add package Majorsilence.CrystalCmd.Client
This example will call the server and return the pdf report as a stream.
DataTable dt = new DataTable();

// init reprt data
var reportData = new Majorsilence.CrystalCmd.Common.Data()
{
    DataTables = new Dictionary<string, string>(),
    MoveObjectPosition = new List<Majorsilence.CrystalCmd.Common.MoveObjects>(),
    Parameters = new Dictionary<string, object>(),
    SubReportDataTables = new List<Majorsilence.CrystalCmd.Common.SubReports>()
};

// add as many data tables as needed.  The client library will do the necessary conversions to json/csv.
reportData.AddData("report name goes here", "table name goes here", dt);

// export to pdf
var crystalReport = System.IO.File.ReadAllBytes("The rpt template file path goes here");
using (var instream = new MemoryStream(crystalReport))
using (var outstream = new MemoryStream())
{

    //var rpt = new Majorsilence.CrystalCmd.Client.Report(serverUrl, username: "The server username goes here", password: "The server password goes here");
    var rpt = new Majorsilence.CrystalCmd.Client.ReportWithPolling(serverUrl, username: "The server username goes here", password: "The server password goes here");
    using (var stream = await rpt.GenerateAsync(reportData, instream, _httpClient))
    {
        stream.CopyTo(outstream);
        return outstream.ToArray();
    }
}
Git
Github new repo example.
mkdir your_repo
cd your_repo
echo "" >> README.md
git init
git add README.md
git commit -m "first commit"
git branch -M main
git remote add origin git@github.com:YOUR_USERNAME/YOUR_REPO.git
git push -u origin main
Push an existing local repo to a new github repo.
git remote add origin git@github.com:YOUR_USERNAME/YOUR_REPO.git
git branch -M main
git push -u origin main
Git, show current branch.
git branch --show-current
Git, show remotes.
git branch --remotes
Git commit changes.
git commit -m "hello world"
Git pull/rebase from
git pull --rebase
Git pull from remote and branch.
git pull --rebase upstream main
Git Visual Studio
Git Rider
How to efficiently use Git integration in JetBrains Rider
Tortoise Git
The Power of Git – in a Windows Shell
Tortoise Git - windows shell git integration
Github Desktop
Experience Git without the struggle
Databases - SQLite
SQLite
SQLite is a lightweight, serverless, self-contained SQL database engine. It stores the entire database as a single file on disk, requires no separate server process, and is included in .NET by default. SQLite is ideal for development, prototyping, desktop, mobile, and small-to-medium web applications.
Why use SQLite for new projects?
- Zero configuration: No server setup or management required.
- Easy to use: Simple file-based deployment—just copy the database file.
- Reliable and fast: ACID-compliant and performant for most workloads.
- Portable: Works across platforms (Windows, Linux, macOS).
- Scalable for prototyping: Start with SQLite, then migrate to a larger DBMS, PostgreSQL, if/when needed.
See Why you should probably be using SQLite.
C# Examples
Install the NuGet package:
dotnet add package Microsoft.Data.Sqlite
Create and query a database:
using Microsoft.Data.Sqlite;

var connectionString = "Data Source=tvshows.db";
using var connection = new SqliteConnection(connectionString);
connection.Open();

// Create table
var createCmd = connection.CreateCommand();
createCmd.CommandText = @"
    CREATE TABLE IF NOT EXISTS TvShows (
        Id INTEGER PRIMARY KEY AUTOINCREMENT,
        ShowName TEXT NOT NULL,
        Rating REAL
    );";
createCmd.ExecuteNonQuery();

// Insert data
var insertCmd = connection.CreateCommand();
insertCmd.CommandText = "INSERT INTO TvShows (ShowName, Rating) VALUES ($name, $rating);";
insertCmd.Parameters.AddWithValue("$name", "Friends");
insertCmd.Parameters.AddWithValue("$rating", 4.8);
insertCmd.ExecuteNonQuery();

// Query data
var selectCmd = connection.CreateCommand();
selectCmd.CommandText = "SELECT Id, ShowName, Rating FROM TvShows;";
using var reader = selectCmd.ExecuteReader();
while (reader.Read())
{
    Console.WriteLine($"{reader.GetInt32(0)}: {reader.GetString(1)} ({reader.GetDouble(2)})");
}
Note: For more advanced scenarios, consider using Dapper or Entity Framework Core with SQLite as the provider.
SQLite with Dapper
Install NuGet packages:
dotnet add package Dapper
dotnet add package Microsoft.Data.Sqlite
Example: Querying SQLite with Dapper
using System;
using System.Collections.Generic;
using Dapper;
using Microsoft.Data.Sqlite;

public class TvShow
{
    public int Id { get; set; }
    public string ShowName { get; set; }
    public double Rating { get; set; }
}

public class Example
{
    public IEnumerable<TvShow> GetShows()
    {
        using var conn = new SqliteConnection("Data Source=tvshows.db");
        conn.Open();
        return conn.Query<TvShow>("SELECT Id, ShowName, Rating FROM TvShows WHERE Rating > @minRating", new { minRating = 4.0 });
    }
}
SQLite with Entity Framework Core
Install NuGet packages:
dotnet add package Microsoft.EntityFrameworkCore
dotnet add package Microsoft.EntityFrameworkCore.Sqlite
Example: DbContext and Model
using Microsoft.EntityFrameworkCore;

public class TvShow
{
    public int Id { get; set; }
    public string ShowName { get; set; }
    public double Rating { get; set; }
}

public class AppDbContext : DbContext
{
    public DbSet<TvShow> TvShows { get; set; }

    protected override void OnConfiguring(DbContextOptionsBuilder options)
        => options.UseSqlite("Data Source=tvshows.db");
}

// Usage
using var db = new AppDbContext();
db.TvShows.Add(new TvShow { ShowName = "Friends", Rating = 4.8 });
db.SaveChanges();

var highRated = db.TvShows.Where(t => t.Rating > 4.0).ToList();
Databases - PostgreSQL
PostgreSQL - Install
Follow the instructions found at https://www.postgresql.org/download/.
See the majorsilence PostgreSQL page for fedora and ubuntu configuration instructions instructions.
For managing PostgreSQL databases use pgAdmin.
PostgreSQL Examples
Create a Table
CREATE TABLE tv_shows (
    id SERIAL PRIMARY KEY,
    show_name VARCHAR(100) NOT NULL,
    rating NUMERIC(3,1)
);
Insert Data
INSERT INTO tv_shows (show_name, rating) VALUES ('Friends', 4.8);
INSERT INTO tv_shows (show_name, rating) VALUES ('Dexter', 4.5);
Stored Procedure
A stored procedure to insert a new TV show:
CREATE OR REPLACE PROCEDURE insert_tv_show(p_show_name VARCHAR, p_rating NUMERIC)
LANGUAGE plpgsql
AS $$
BEGIN
    INSERT INTO tv_shows (show_name, rating) VALUES (p_show_name, p_rating);
END;
$$;
Call the procedure:
CALL insert_tv_show('Frasier', 4.6);
Stored Function
A function to get the average rating:
CREATE OR REPLACE FUNCTION get_average_rating()
RETURNS NUMERIC AS $$
BEGIN
    RETURN (SELECT AVG(rating) FROM tv_shows);
END;
$$ LANGUAGE plpgsql;
Usage:
SELECT get_average_rating();
View
A view showing only highly rated shows:
CREATE OR REPLACE VIEW high_rated_shows AS
SELECT id, show_name, rating
FROM tv_shows
WHERE rating >= 4.5;
Query the view:
SELECT * FROM high_rated_shows;
C# Example: Querying PostgreSQL
Install the Npgsql NuGet package:
dotnet add package Npgsql
Sample C# code:
using Npgsql;

var connString = "Host=localhost;Username=postgres;Password=yourpassword;Database=yourdb";
using var conn = new NpgsqlConnection(connString);
conn.Open();

// Query data
using var cmd = new NpgsqlCommand("SELECT id, show_name, rating FROM tv_shows", conn);
using var reader = cmd.ExecuteReader();
while (reader.Read())
{
    Console.WriteLine($"{reader.GetInt32(0)}: {reader.GetString(1)} ({reader.GetDecimal(2)})");
}

// Call a function
using var avgCmd = new NpgsqlCommand("SELECT get_average_rating()", conn);
var avg = avgCmd.ExecuteScalar();
Console.WriteLine($"Average rating: {avg}");
Note: For async usage, use await conn.OpenAsync() and await cmd.ExecuteReaderAsync().
PostgreSQL with Dapper
Dapper is a lightweight ORM for .NET that works well with PostgreSQL via the Npgsql driver.
Install NuGet packages:
dotnet add package Dapper
dotnet add package Npgsql
Example: Querying PostgreSQL with Dapper
using System;
using System.Collections.Generic;
using System.Threading.Tasks;
using Dapper;
using Npgsql;

public class TvShow
{
    public int Id { get; set; }
    public string ShowName { get; set; }
    public decimal Rating { get; set; }
}

public class Example
{
    public async Task<IEnumerable<TvShow>> GetShowsAsync()
    {
        var connString = "Host=localhost;Username=postgres;Password=yourpassword;Database=yourdb";
        using var conn = new NpgsqlConnection(connString);
        await conn.OpenAsync();

        var sql = "SELECT id, show_name AS ShowName, rating FROM tv_shows WHERE rating > @minRating";
        return await conn.QueryAsync<TvShow>(sql, new { minRating = 4.0m });
    }
}
PostgreSQL with Entity Framework Core
Install NuGet packages:
dotnet add package Microsoft.EntityFrameworkCore
dotnet add package Npgsql.EntityFrameworkCore.PostgreSQL
Example: DbContext and Model
using Microsoft.EntityFrameworkCore;

public class TvShow
{
    public int Id { get; set; }
    public string ShowName { get; set; }
    public decimal Rating { get; set; }
}

public class AppDbContext : DbContext
{
    public DbSet<TvShow> TvShows { get; set; }

    protected override void OnConfiguring(DbContextOptionsBuilder options)
        => options.UseNpgsql("Host=localhost;Username=postgres;Password=yourpassword;Database=yourdb");
}

// Usage
using var db = new AppDbContext();
db.TvShows.Add(new TvShow { ShowName = "Friends", Rating = 4.8m });
db.SaveChanges();

var highRated = db.TvShows.Where(t => t.Rating > 4.0m).ToList();
Note:
- Use migrations to create/update your PostgreSQL schema:
dotnet ef migrations add InitialCreate
dotnet ef database update - See Npgsql EF Core docs for advanced usage.
Databases - Microsoft SQL
All sql scripts included in this section expect to be run in sql server management studio, azure data studio, or your preferred sql tool. If you need to install sql server skip to the SQL - Install section.
Adventure Works
While many of the sql examples shown will not use the adventure works sample database I suggest that it is restored and used to investigate sql server.
For a more detailed sample database download and restore Microsoft’s AdventureWorks database.
Before restoring the bak change the owner to mssql and move it to a folder that sql server has permissions to access.
sudo mkdir -p /var/opt/mssql/backup/
sudo chown mssql /var/opt/mssql/backup/
sudo chgrp mssql /var/opt/mssql/backup/
chown mssql AdventureWorksLT2019.bak
chgrp mssql AdventureWorksLT2019.bak
sudo mv AdventureWorksLT2019.bak  /var/opt/mssql/backup/
Find the logical names
USE [master];
GO
RESTORE FILELISTONLY
FROM DISK = '/var/opt/mssql/backup/AdventureWorksLT2019.bak'
Restore the database.
USE [master];
GO
RESTORE DATABASE [AdventureWorks2019]
FROM DISK = '/var/opt/mssql/backup/AdventureWorksLT2019.bak'
WITH
    MOVE 'AdventureWorksLT2012_Data' TO '/var/opt/mssql/data/AdventureWorks2019.mdf',
    MOVE 'AdventureWorksLT2012_Log' TO '/var/opt/mssql/data/AdventureWorks2019_log.ldf',
    FILE = 1,
    NOUNLOAD,
    STATS = 5;
GO
Create a database
use master;
create database SqlPlayground;
Create a table
Create a table using a UNIQUEIDENTIFIER (sequential guid) column as the primary key.
use SqlPlayground;

create table [dbo].[TvShows]
(
    Id UNIQUEIDENTIFIER NOT NULL PRIMARY KEY DEFAULT NEWSEQUENTIALID(),
    ShowName nvarchar(50) not null,
    ShowLength int not null,
    Summary nvarchar(max) not null,
    Rating decimal(18,2) null,
    Episode nvarchar(200) not null,
    ParentalGuide nvarchar(5) null
)
As an alternative, create the table with a bigint identity column as the primary key.
create table [dbo].[TvShows]
(
    Id BIGINT NOT NULL IDENTITY PRIMARY KEY,
    ShowName nvarchar(50) not null,
    ShowLength int not null,
    Summary nvarchar(max) not null,
    Rating decimal(18,2) null,
    Episode nvarchar(200) not null,
    ParentalGuide nvarchar(5) null
)
Note: schemas, tables, and column names can be surrounded in square brackets []. This is for when special characters or reserved keywords are part of the name.
Alter a table
alter table TvShows
add FirstAiredUtc DateTime;
Create indexes
Review Clustered and nonclustered indexes described and CREATE INDEX.
create index index_tvshows_showname ON dbo.TvShows (ShowName);
SELECT
select * from TvShows;
select * from TvShows where Series = 'Dexter';
select Id, ShowName, ShowLength, Summary, FirstAiredUtc
from TvShows;
INSERT
Insert a new row into a table.
insert into TvShows (ShowName, ShowLength, Summary, Rating, Episode, ParentalGuide)
values ('Frasier', '30', 'Frasier goes home.', 4.56, '1e01', 'PG');
Insert a new row into a table and select back the new unique identifier of that row.
declare @InsertedRowIds table(InsertedId UNIQUEIDENTIFIER);

insert into TvShows (ShowName, ShowLength, Summary, Rating, Episode, ParentalGuide)
OUTPUT inserted.Id INTO  @InsertedRowIds(InsertedId)
values ('Frasier', '30', 'Frasier does it again.', 3.68, '2e01', 'PG');

select * FROM @InsertedRowIds;
Insert a new row into a table that uses a bigint identity column and select back the new id of that row.
insert into TvShows (ShowName, ShowLength, Summary, Rating, Episode, ParentalGuide)
values ('Frasier', '30', 'Frasier does it again.', 3.68, '2e01', 'PG');

select SCOPE_IDENTITY();
Further reading
UPDATE
When executing updates be sure to include a where clause to avoid updating every record in a table.
update TvShows set ParentalGuide = 'PG13' where ShowName='Friends';
update TvShows set ParentalGuide = 'PG' where ShowName = 'Frasier';
update TvShows set ParentalGuide = '18A' where ShowName = 'Dexter';
update TvShows set ParentalGuide = 'PG' where ShowName in ('Friends', 'Frasier');
DELETE
When executing deletes be sure to include a where clause to avoid deleting every record in a table.
delete from TvShows where ShowName = 'Dexter';
Foreign Keys
A foreign key is a constraint that enforces a relationship between columns in two tables, ensuring that the value in one table matches a value in another. This maintains referential integrity between related data.
For example, suppose you have a TvShows table and an Episodes table. Each episode references a TV show by its TvShowId:
CREATE TABLE TvShows (
    Id BIGINT NOT NULL IDENTITY PRIMARY KEY,
    ShowName NVARCHAR(50) NOT NULL
);

CREATE TABLE Episodes (
    Id BIGINT NOT NULL IDENTITY PRIMARY KEY,
    TvShowId BIGINT NOT NULL,
    EpisodeName NVARCHAR(100) NOT NULL,
    FOREIGN KEY (TvShowId) REFERENCES TvShows(Id)
);
In this example, Episodes.TvShowId must match an existing TvShows.Id, ensuring episodes are always linked to a valid TV show.
JOIN
A JOIN in SQL combines rows from two or more tables based on a related column between them. The most common type is an INNER JOIN, which returns only the rows where there is a match in both tables.
Example:
Suppose you have TvShows and Episodes tables. To list all episodes with their show names:
SELECT
    TvShows.ShowName,
    Episodes.EpisodeName
FROM
    TvShows
INNER JOIN
    Episodes ON TvShows.Id = Episodes.TvShowId;
This query returns each episode along with the name of its TV show.
CTE
A Common Table Expression (CTE) is a temporary result set in SQL that you can reference within a SELECT, INSERT, UPDATE, or DELETE statement. CTEs make complex queries easier to read and maintain, and are especially useful for recursive queries or breaking down large queries into logical building blocks.
Example:
Suppose you want to select all TV shows with a rating above 4.0 and then count them.
WITH HighRatedShows AS (
    SELECT *
    FROM TvShows
    WHERE Rating > 4.0
)
SELECT COUNT(*) AS HighRatedShowCount
FROM HighRatedShows;
In this example, the CTE HighRatedShows selects all shows with a rating above 4.0, and the main query counts how many such shows exist.
Stored Procedures
A stored procedure in SQL Server is a precompiled collection of one or more T-SQL statements that can be executed as a single unit. Stored procedures help encapsulate logic, improve performance, and promote code reuse.
Example:
This stored procedure selects all TV shows with a rating above a specified value:
CREATE PROCEDURE GetHighRatedTvShows
    @MinRating DECIMAL(18,2)
AS
BEGIN
    SELECT *
    FROM TvShows
    WHERE Rating >= @MinRating;
END
To execute the procedure:
EXEC GetHighRatedTvShows @MinRating = 4.5;
This will return all rows from TvShows where the Rating is 4.5 or higher.
Stored Functions
A stored function in SQL Server is a user-defined function (UDF) that returns a single value or a table. Functions can be used in queries, computed columns, or as part of expressions. Unlike stored procedures, functions must return a value and cannot modify database state (no INSERT, UPDATE, or DELETE).
Example:
This scalar-valued function returns the full name of a TV show episode by combining the show name and episode name.
CREATE FUNCTION dbo.GetFullEpisodeName
(
    @ShowName NVARCHAR(50),
    @EpisodeName NVARCHAR(100)
)
RETURNS NVARCHAR(200)
AS
BEGIN
    RETURN @ShowName + ' - ' + @EpisodeName
END
Usage:
SELECT dbo.GetFullEpisodeName('Friends', 'The One Where It All Began') AS FullEpisodeName;
Views
A view in SQL Server is a virtual table based on the result of a SELECT query. Views simplify complex queries, encapsulate logic, and can help restrict access to specific data.
Example:
Create a view that lists only TV shows with a rating above 4.0:
CREATE VIEW HighRatedTvShows AS
SELECT Id, ShowName, Rating
FROM TvShows
WHERE Rating > 4.0;
You can then query the view like a table:
SELECT * FROM HighRatedTvShows;
SQL - Install
SQL server windows install
Download sql server from Microsoft. The simple install method is to double click the setup.exe and use the user interface to complete the install.
If it is a non production environment, for development choose the developer edition.
If you wish to automate the install it can be script with options similar to the below example.
setup.exe /ACTION=INSTALL /IACCEPTSQLSERVERLICENSETERMS /FEATURES="SQL,Tools" /SECURITYMODE=SQL /SAPWD="PLACEHOLDER, PUT A GOOD PASSWORD HERE" /SQLSVCACCOUNT="NT AUTHORITY\Network Service" /SQLSVCSTARTUPTYPE=Automatic /TCPENABLED=1 /SQLSYSADMINACCOUNTS=".\Users" ".\Administrator" /SQLCOLLATION="SQL_Latin1_General_CP1_CI_AS"
Review the Install SQL Server on Windows from the command prompt page for up to date options and documentation.
SQL server linux install
See Quickstart: Install SQL Server and create a database on Ubuntu and for further details.
Run these commands to install sql server 2022 on a ubuntu server.
# Download the Microsoft repository GPG keys
wget -qO- https://packages.microsoft.com/keys/microsoft.asc | sudo tee /etc/apt/trusted.gpg.d/microsoft.asc
sudo add-apt-repository "$(wget -qO- https://packages.microsoft.com/config/ubuntu/$(lsb_release -rs)/mssql-server-2022.list)"
# Update the list of packages after we added packages.microsoft.com
sudo apt-get update
# Install PowerShell
sudo apt-get install mssql-server
sudo /opt/mssql/bin/mssql-conf setup
To enable the sql agent feature run this command:
sudo /opt/mssql/bin/mssql-conf set sqlagent.enabled true
sudo systemctl restart mssql-server
If the command line tools are also required run these commands:
wget -qO- https://packages.microsoft.com/keys/microsoft.asc | sudo tee /etc/apt/trusted.gpg.d/microsoft.asc
wget -qO- https://packages.microsoft.com/config/ubuntu/$(lsb_release -rs)/prod.list | sudo tee /etc/apt/sources.list.d/msprod.list
sudo apt-get update
sudo apt-get install mssql-tools unixodbc-dev

echo 'export PATH="$PATH:/opt/mssql-tools/bin"' >> ~/.bash_profile
SQL server extra configuration after the install
Set some initial configuration options in sql management studio or azure data studio. Run the following sql.
sp_configure 'show advanced options', 1
reconfigure with override

sp_configure 'max server memory (MB)', -- 90% of OS MEM
reconfigure with override
-
SQL Management Studio
- sql options (database properties)
- recovery model: full
- If the data is non production or not important feel free to use the simple recovery mode.
- Log and Data Growth: 10%
- Compatiablity: latest version
- Query Store - enable “Read write”
- recovery model: full
- sql options (database properties)
-
SQL Server Configuration Manager -> Protocols
- Set “Force Encryption” to “yes”
Reference - Admin
Use spBlitz (SQL First Responder Kit) to detect problems with sql server. Follow the instructions on the spBlitz site.
A few examples:
-- Realtime performance advice that should be run first when responding to an incident or case
exec sp_BlitzFirst

-- Overall Health Check
exec sp_Blitz

-- Find the Most Resource-Intensive Queries
exec sp_BlitzCache

-- Tune Your Indexes
exec sp_BlitzIndex
Use the Ola Hallengren SQL Server Maintenance Solutions for excellent pre-made community backed maintenance jobs.
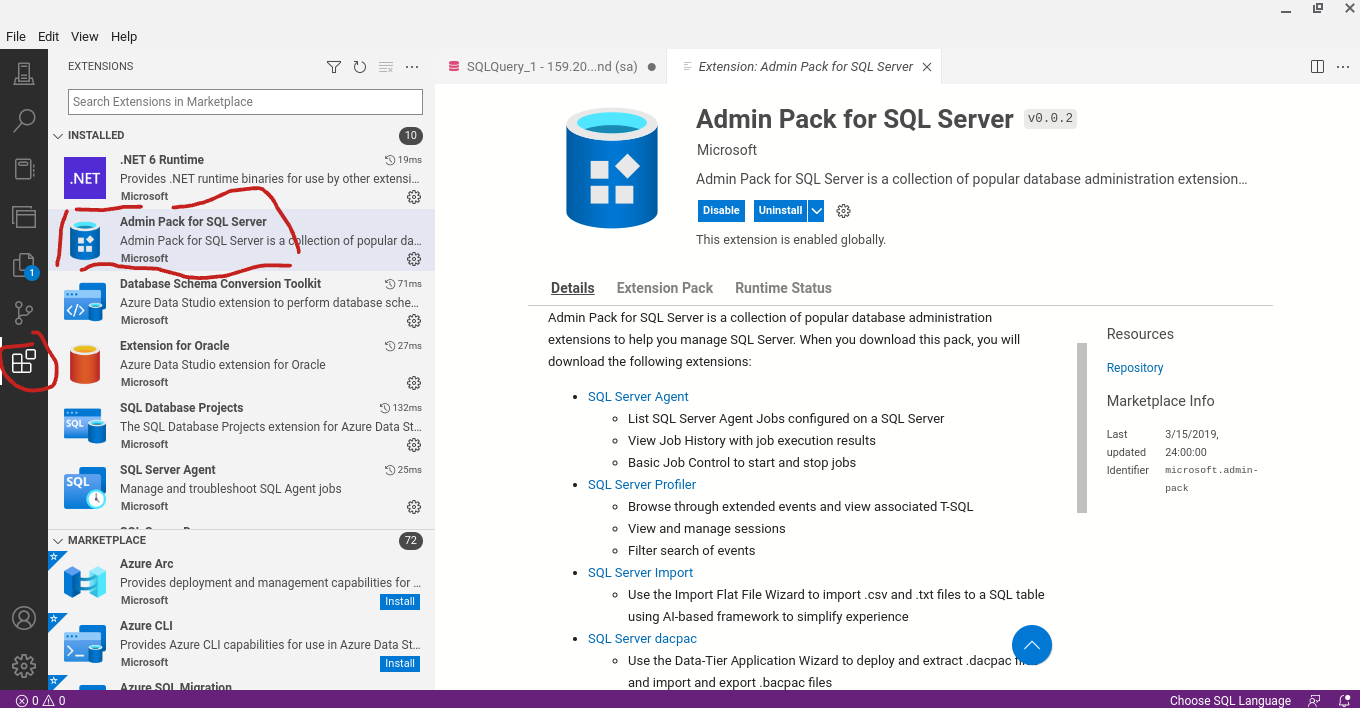
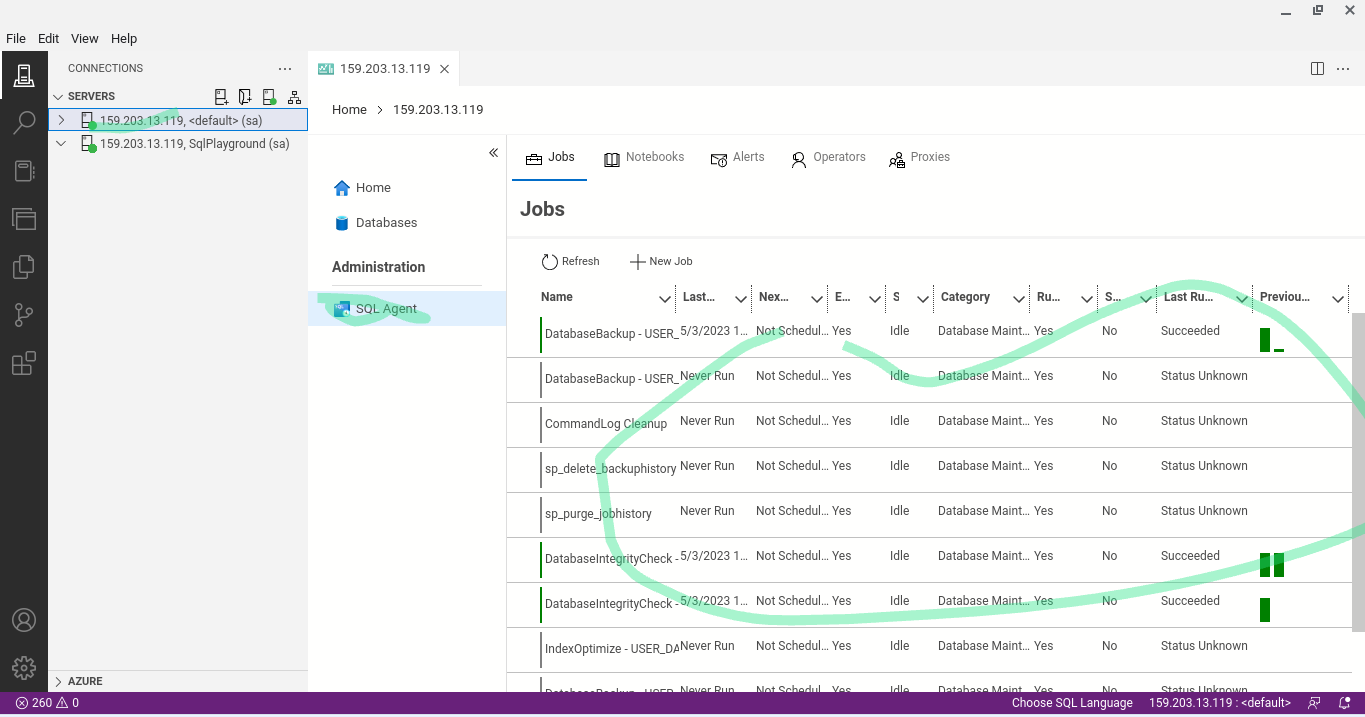
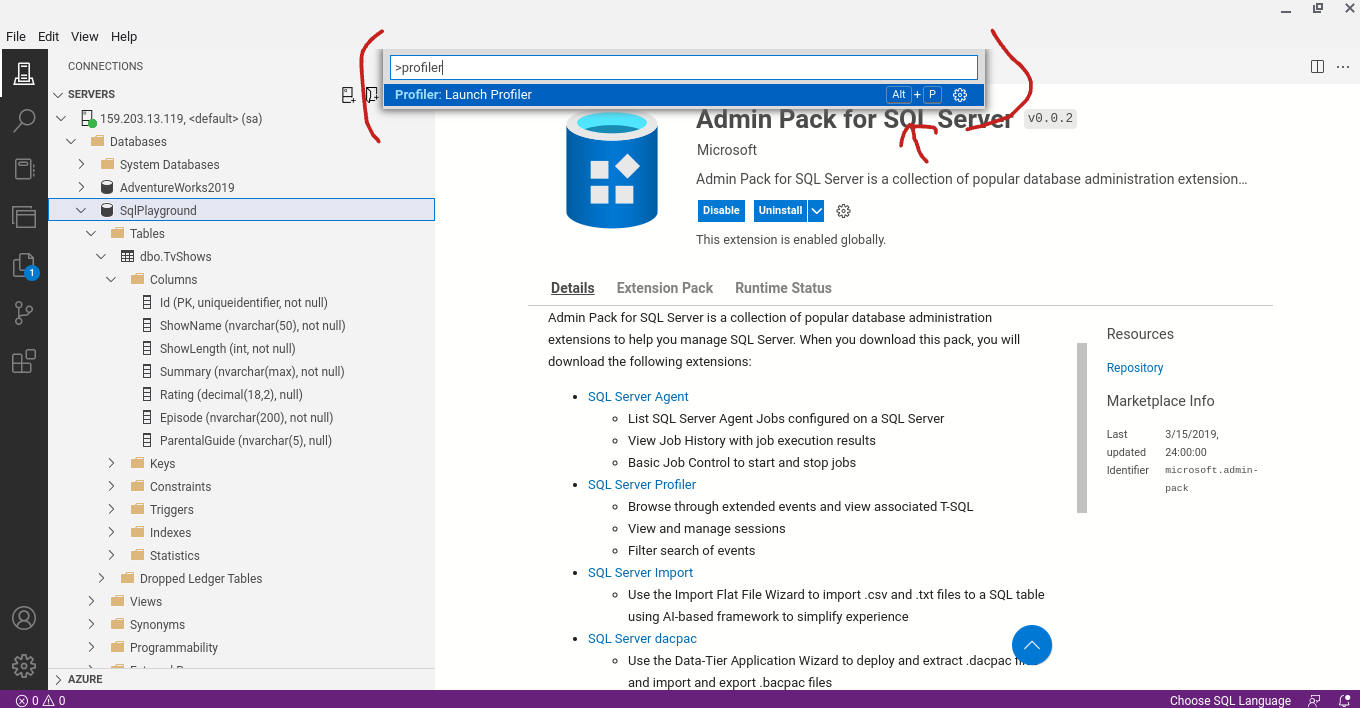
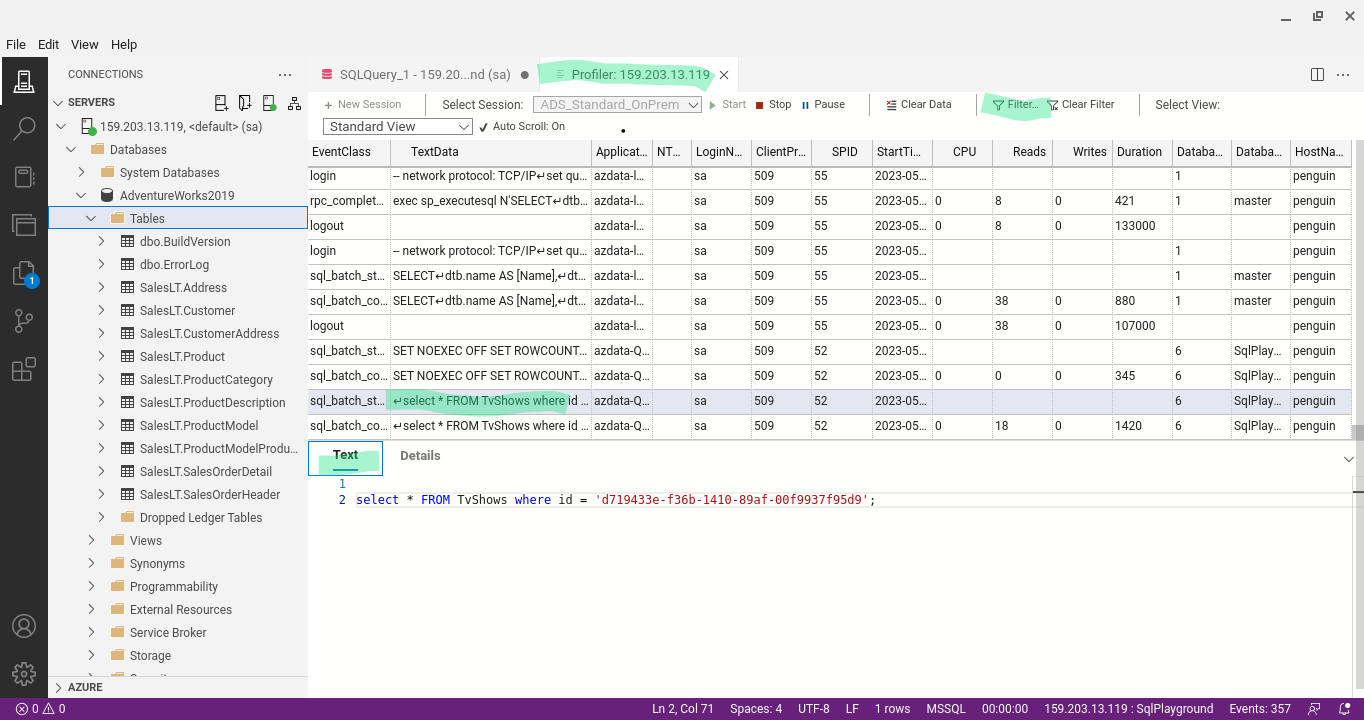
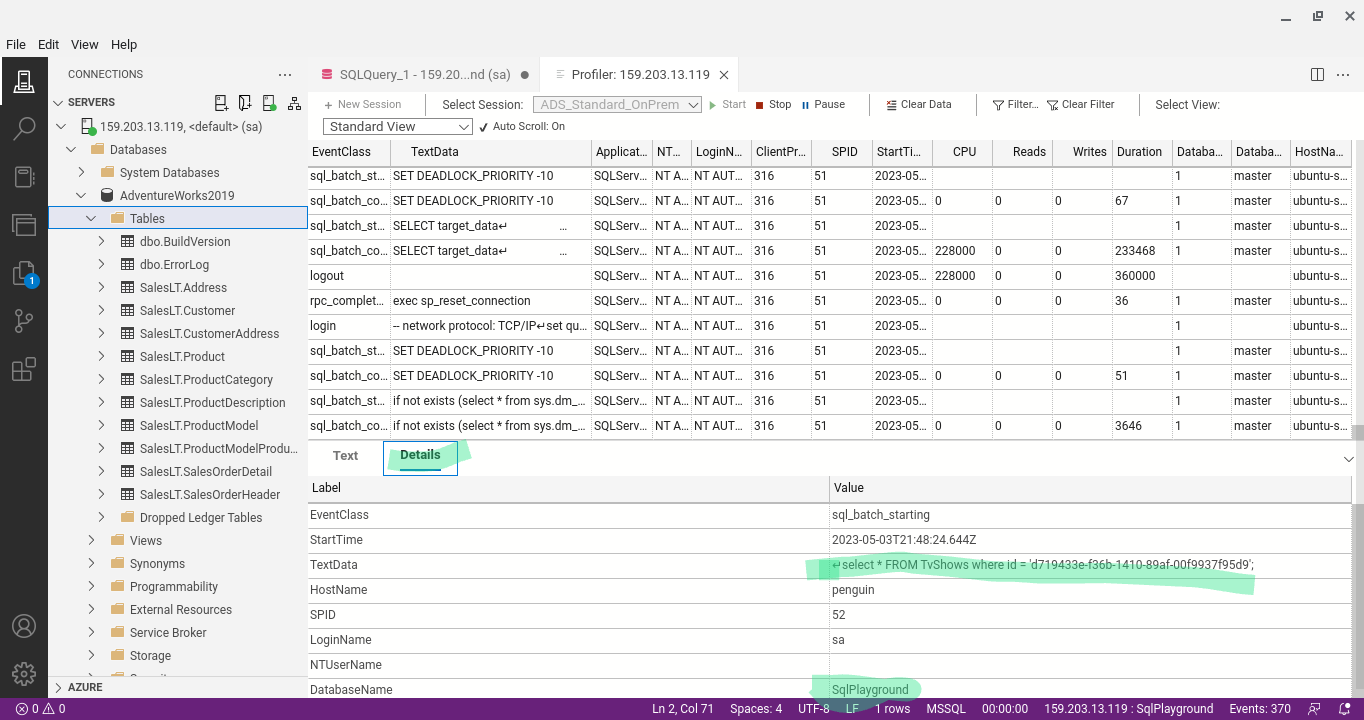
SQL Profiler
SQL Query Store
Monitor performance by using the Query Store
SQL Watch
SQL Watch - sql monitor.
Databases - Redis
Redis is an open-source, in-memory data store commonly used as a database, cache, and message broker. It supports data structures such as strings, hashes, lists, sets, and more, and is known for its high performance and simplicity.
forks:
- Valkey: A community-driven fork supported by the Linux Foundation, aiming to maintain an open-source alternative.
- Redict: Another fork focused on preserving the original open-source spirit of Redis.
These forks are compatible with Redis and are intended to provide drop-in replacements for users who require a fully open-source solution.
Other redis compatible solutions:
Ubuntu Install
sudo apt update
sudo apt install redis-server
sudo cp /etc/redis/redis.conf /etc/redis/redis.conf.backup

sudo ufw allow ssh
sudo ufw allow redis
sudo ufw allow 6380/tcp
sudo ufw enable
sudo ufw status
Add redis password
/etc/redis/redis.conf
add
user default on >[PLACEHOLDER] ~* +@all
acl-pubsub-default allchannels
Connect to password protected redis server
redis-cli -h 127.0.0.1 -p 6379
AUTH [PLACEHOLDER]
expose to the network
sudo vim /etc/redis/redis.conf
bind 0.0.0.0
Restart on failure
Ensure restart on failure is enabled
sudo cat /lib/systemd/system/redis-server.service
- Look for Restart Policies:
Within the service file, look for directives related to the restart policy. Common directives include
RestartandRestartSec.
Example:
[Service]
Type=notify
ExecStart=/usr/bin/redis-server /etc/redis/redis.conf
ExecStop=/usr/bin/redis-shutdown
User=redis
Group=redis
RuntimeDirectory=redis
RuntimeDirectoryMode=2755
PIDFile=/run/redis/redis-server.pid
TimeoutStopSec=0
Restart=on-failure
RestartSec=5
- Modify the Service Configuration if Necessary:
If the
Restartdirective is not set or you want to customize it, you can create a systemd override file to modify the service configuration without changing the original service file.
sudo systemctl edit redis-server
This command opens an editor where you can add or override directives. For example, to ensure the service restarts on failure, you can add:
[Unit]
StartLimitIntervalSec=0  # Disable the limit on the time window
StartLimitBurst=0        # Disable the limit on the number of restart attempts

[Service]
Restart=always           # Always restart the service
RestartSec=10            # Wait 10 seconds before restarting
- Reload Systemd and Restart the Service: After making changes, reload the systemd configuration and restart the Redis service to apply the changes.
sudo systemctl daemon-reload
sudo systemctl restart redis-server
- Verify the Configuration: Finally, you can verify that the service is configured correctly by checking its status.
sudo systemctl status redis-server
TLS Connection Support
If TLS support is enabled the client connection strings must be configured to use it.
1. Generate SSL/TLS Certificates
You can generate self-signed certificates for testing purposes or obtain certificates from a trusted Certificate Authority (CA) for production use. Here’s how to generate self-signed certificates using OpenSSL:
# Create a directory to store the certificates
mkdir -p /etc/redis/ssl
cd /etc/redis/ssl

# Generate a private key
openssl genrsa -out redis-server.key 2048

# Generate a self-signed certificate
openssl req -new -x509 -key redis-server.key -out redis-server.crt -days 3652

# Generate a private key for the client
openssl genrsa -out redis-client.key 2048

# Generate a certificate signing request (CSR) for the client
openssl req -new -key redis-client.key -out redis-client.csr

# Generate a self-signed certificate for the client
openssl x509 -req -in redis-client.csr -CA redis-server.crt -CAkey redis-server.key -CAcreateserial -out redis-client.crt -days 3652

chgrp -R redis /etc/redis/ssl
chown -R redis /etc/redis/ssl
2. Configure Redis to Use TLS
Edit the Redis configuration file (/etc/redis/redis.conf) to enable TLS and specify the paths to your certificates and keys.
# Non-TLS port, disable for enhanced security
port 6379

# Enable TLS
tls-port 6380

# Specify the paths to the certificates and keys
tls-cert-file /etc/redis/ssl/redis-server.crt
tls-key-file /etc/redis/ssl/redis-server.key
tls-ca-cert-file /etc/redis/ssl/redis-server.crt

# Optional: Require clients to authenticate using a client certificate
tls-auth-clients no
3. Restart Redis Server
After making these changes, restart the Redis server to apply the new configuration.
sudo systemctl restart redis-server
Session
To use Redis for web sessions in C#, add the Microsoft.Extensions.Caching.StackExchangeRedis NuGet package to your ASP.NET Core project. In Program.cs, configure session state to use Redis as the backing store:
builder.Services.AddStackExchangeRedisCache(options =>
{
    options.Configuration = "localhost:6379,password=yourpassword";
    options.InstanceName = "SampleInstance";
});

builder.Services.AddSession(options =>
{
    options.Cookie.HttpOnly = true;
    options.Cookie.IsEssential = true;
    options.IdleTimeout = TimeSpan.FromMinutes(30);
});

app.UseSession();
You can then use HttpContext.Session to store and retrieve session data. Redis will persist session state across web server restarts and scale-out scenarios.
Cache
To use Redis as a distributed cache in a C# ASP.NET Core application, add the Microsoft.Extensions.Caching.StackExchangeRedis NuGet package. Configure Redis in Program.cs:
builder.Services.AddStackExchangeRedisCache(options =>
{
    options.Configuration = "localhost:6379,password=yourpassword";
    options.InstanceName = "SampleInstance";
});
You can then use IDistributedCache to store and retrieve cached data:
public class MyController : Controller
{
    private readonly IDistributedCache _cache;

    public MyController(IDistributedCache cache)
    {
        _cache = cache;
    }

    public async Task<IActionResult> Index()
    {
        var value = await _cache.GetStringAsync("myKey");
        if (value == null)
        {
            value = "Hello from Redis cache!";
            await _cache.SetStringAsync("myKey", value, new DistributedCacheEntryOptions
            {
                AbsoluteExpirationRelativeToNow = TimeSpan.FromMinutes(10)
            });
        }
        return Content(value);
    }
}
This enables fast, centralized caching for web applications, improving performance and scalability.
Publish and Subscribe
Publish/Subscribe (Pub/Sub) is a messaging pattern where senders (publishers) send messages to channels without knowing who will receive them, and receivers (subscribers) listen for messages on those channels. Redis provides built-in support for Pub/Sub, enabling real-time messaging between distributed components.
Using Redis Pub/Sub in C#
To use Redis Pub/Sub in a C# application, add the StackExchange.Redis NuGet package. You can then publish and subscribe to messages as shown below:
using StackExchange.Redis;

var redis = ConnectionMultiplexer.Connect("localhost:6379,password=yourpassword");
var pubsub = redis.GetSubscriber();

// Subscribe to a channel
pubsub.Subscribe("notifications", (channel, message) => {
    Console.WriteLine($"Received: {message}");
});

// Publish a message to the channel
pubsub.Publish("notifications", "Hello from publisher!");

// Keep the application running to receive messages
Console.ReadLine();
This allows different parts of your application (or different applications) to communicate in real time using Redis channels.
Example: Redis Pub/Sub with Web Frontend and Worker Services
This example demonstrates a simple architecture where:
- A web frontend allows users to submit work (e.g., a “task”).
- The frontend publishes the task to a Redis channel.
- One or more worker services (in separate processes) subscribe to the channel, process the task, and publish a completion message to another channel.
- The frontend listens for completion messages and notifies the user when their task is done.
1. Web Frontend (ASP.NET Core + JavaScript)
Backend Controller (C#):
// Controller to accept user input and publish to Redis
[ApiController]
[Route("api/[controller]")]
public class TasksController : ControllerBase
{
    private readonly IConnectionMultiplexer _redis;
    public TasksController(IConnectionMultiplexer redis) => _redis = redis;

    [HttpPost]
    public async Task<IActionResult> SubmitTask([FromBody] TaskRequest request)
    {
        var id = Guid.NewGuid().ToString();
        var pub = _redis.GetSubscriber();
        await pub.PublishAsync("tasks", $"{id}:{request.Payload}");
        return Ok(new { taskId = id });
    }
}

public class TaskRequest
{
    public string Payload { get; set; }
}
Frontend (HTML + JavaScript):
<input id="taskInput" placeholder="Enter task" />
<button onclick="submitTask()">Submit</button>
<div id="status"></div>
<script>
let taskId = null;
function submitTask() {
    const payload = document.getElementById('taskInput').value;
    fetch('/api/tasks', {
        method: 'POST',
        headers: { 'Content-Type': 'application/json' },
        body: JSON.stringify({ payload })
    })
    .then(r => r.json())
    .then(data => {
        taskId = data.taskId;
        document.getElementById('status').innerText = 'Task submitted. Waiting for completion...';
    });
}

// Listen for completion via WebSocket (SignalR or custom implementation)
const ws = new WebSocket('wss://yourserver/ws');
ws.onmessage = function(event) {
    const msg = JSON.parse(event.data);
    if (msg.taskId === taskId) {
        document.getElementById('status').innerText = 'Task complete: ' + msg.result;
    }
};
</script>
Note: The backend should push completion messages to the frontend via WebSocket (e.g., using SignalR).
2. Worker Service (C# Console App)
using StackExchange.Redis;

var redis = ConnectionMultiplexer.Connect("localhost:6379,password=yourpassword");
var sub = redis.GetSubscriber();

sub.Subscribe("tasks", async (channel, message) => {
    var parts = message.ToString().Split(':', 2);
    var taskId = parts[0];
    var payload = parts[1];

    // Simulate work
    await Task.Delay(2000);
    var result = payload.ToUpperInvariant();

    // Publish completion
    await sub.PublishAsync("tasks-complete", $"{taskId}:{result}");
});

Console.WriteLine("Worker running. Press Enter to exit.");
Console.ReadLine();
3. Completion Notification Service
A background service (e.g., in your ASP.NET Core app) subscribes to "tasks-complete" and pushes updates to the frontend via WebSocket/SignalR.
public class CompletionNotifier : BackgroundService
{
    private readonly IConnectionMultiplexer _redis;
    private readonly IHubContext<NotifyHub> _hub;
    public CompletionNotifier(IConnectionMultiplexer redis, IHubContext<NotifyHub> hub)
    {
        _redis = redis; _hub = hub;
    }

    protected override Task ExecuteAsync(CancellationToken stoppingToken)
    {
        var sub = _redis.GetSubscriber();
        return sub.SubscribeAsync("tasks-complete", async (ch, msg) => {
            var parts = msg.ToString().Split(':', 2);
            var taskId = parts[0];
            var result = parts[1];
            await _hub.Clients.All.SendAsync("TaskCompleted", new { taskId, result });
        });
    }
}
SignalR Hub:
public class NotifyHub : Hub { }
Frontend SignalR Listener:
const connection = new signalR.HubConnectionBuilder().withUrl("/notifyhub").build();
connection.on("TaskCompleted", function(msg) {
    if (msg.taskId === taskId) {
        document.getElementById('status').innerText = 'Task complete: ' + msg.result;
    }
});
connection.start();
This pattern enables real-time user feedback for background work using Redis Pub/Sub, web frontend, and worker services.
Work and Message Queue with Redis in C#
A work queue (also known as a message queue or task queue) allows producers to enqueue work items, and one or more consumers (workers) to process them asynchronously. Redis is commonly used for this pattern using its list commands (LPUSH/RPUSH to enqueue, BRPOP/BLPOP to dequeue).
Producer Example (Enqueue Work)
using StackExchange.Redis;

var redis = ConnectionMultiplexer.Connect("localhost:6379,password=yourpassword");
var db = redis.GetDatabase();

// Enqueue a work item (e.g., a JSON string or simple string)
await db.ListRightPushAsync("work-queue", "do_something:12345");
Consumer Example (Worker)
using StackExchange.Redis;

var redis = ConnectionMultiplexer.Connect("localhost:6379,password=yourpassword");
var db = redis.GetDatabase();

while (true)
{
    // BRPOP blocks until an item is available
    var result = await db.ListRightPopLeftPushAsync("work-queue", "processing-queue");
    if (result.HasValue)
    {
        var workItem = result.ToString();
        Console.WriteLine($"Processing: {workItem}");

        // Do work here...

        // Optionally remove from processing-queue after successful processing
        await db.ListRemoveAsync("processing-queue", workItem);
    }
}
Notes:
- Use
ListRightPushAsyncto enqueue work. - Use
ListLeftPopAsyncor blockingListLeftPopAsync(orBRPOP/BLPOPin raw Redis) to dequeue. - For reliability, consider a “processing” queue to track in-progress work and handle failures.
- For more advanced scenarios, consider libraries like Hangfire.
Database and DotNet
DbConnection
A DbConnection represents an open connection to a database. It is the base class for database-specific connection classes like SqlConnection (SQL Server), NpgsqlConnection (PostgreSQL), and SqliteConnection (SQLite).
Example: Using DbConnection with SQL Server
using System.Data.Common;
using Microsoft.Data.SqlClient;

string connectionString = "Server=localhost;Database=SqlPlayground;User Id=sa;Password=yourpassword;";
using DbConnection conn = new SqlConnection(connectionString);
conn.Open();

using var cmd = conn.CreateCommand();
cmd.CommandText = "SELECT COUNT(*) FROM TvShows";
var count = cmd.ExecuteScalar();
Console.WriteLine($"Number of TV shows: {count}");
Example: Using DbConnection with PostgreSQL
using System.Data.Common;
using Npgsql;

string connectionString = "Host=localhost;Username=postgres;Password=yourpassword;Database=yourdb";
using DbConnection conn = new NpgsqlConnection(connectionString);
conn.Open();

using var cmd = conn.CreateCommand();
cmd.CommandText = "SELECT COUNT(*) FROM tv_shows";
var count = cmd.ExecuteScalar();
Console.WriteLine($"Number of TV shows: {count}");
Example: Using DbConnection with SQLite
using System.Data.Common;
using Microsoft.Data.Sqlite;

string connectionString = "Data Source=tvshows.db";
using DbConnection conn = new SqliteConnection(connectionString);
conn.Open();

using var cmd = conn.CreateCommand();
cmd.CommandText = "SELECT COUNT(*) FROM TvShows";
var count = cmd.ExecuteScalar();
Console.WriteLine($"Number of TV shows: {count}");
Note: Always dispose connections (use using or await using for async) to free resources.
DbCommand
A DbCommand represents a SQL statement or stored procedure to execute against a database. It is the base class for provider-specific commands like SqlCommand (SQL Server), NpgsqlCommand (PostgreSQL), and SqliteCommand (SQLite).
Example: Using DbCommand with SQL Server
using System.Data.Common;
using Microsoft.Data.SqlClient;

string connectionString = "Server=localhost;Database=SqlPlayground;User Id=sa;Password=yourpassword;";
using DbConnection conn = new SqlConnection(connectionString);
conn.Open();

using DbCommand cmd = conn.CreateCommand();
cmd.CommandText = "SELECT ShowName, Rating FROM TvShows WHERE Rating > @minRating";
var param = cmd.CreateParameter();
param.ParameterName = "@minRating";
param.Value = 4.0m;
cmd.Parameters.Add(param);

using var reader = cmd.ExecuteReader();
while (reader.Read())
{
    Console.WriteLine($"{reader.GetString(0)} ({reader.GetDecimal(1)})");
}
Example: Using DbCommand with PostgreSQL
using System.Data.Common;
using Npgsql;

string connectionString = "Host=localhost;Username=postgres;Password=yourpassword;Database=yourdb";
using DbConnection conn = new NpgsqlConnection(connectionString);
conn.Open();

using DbCommand cmd = conn.CreateCommand();
cmd.CommandText = "SELECT show_name, rating FROM tv_shows WHERE rating > @minRating";
var param = cmd.CreateParameter();
param.ParameterName = "@minRating";
param.Value = 4.0m;
cmd.Parameters.Add(param);

using var reader = cmd.ExecuteReader();
while (reader.Read())
{
    Console.WriteLine($"{reader.GetString(0)} ({reader.GetDecimal(1)})");
}
Example: Using DbCommand with SQLite
using System.Data.Common;
using Microsoft.Data.Sqlite;

string connectionString = "Data Source=tvshows.db";
using DbConnection conn = new SqliteConnection(connectionString);
conn.Open();

using DbCommand cmd = conn.CreateCommand();
cmd.CommandText = "SELECT ShowName, Rating FROM TvShows WHERE Rating > $minRating";
var param = cmd.CreateParameter();
param.ParameterName = "$minRating";
param.Value = 4.0;
cmd.Parameters.Add(param);

using var reader = cmd.ExecuteReader();
while (reader.Read())
{
    Console.WriteLine($"{reader.GetString(0)} ({reader.GetDouble(1)})");
}
Note:
- Always use parameters to avoid SQL injection.
- Use
ExecuteReader()for queries,ExecuteNonQuery()for inserts/updates/deletes, andExecuteScalar()for single-value results. - Dispose commands and readers properly (using
usingstatements).
DataAdapters
A DataAdapter acts as a bridge between a DataSet and a database, allowing you to fill in-memory tables and update the database with changes. It is commonly used in ADO.NET for disconnected data access.
Example: Using SqlDataAdapter with SQL Server
using System.Data;
using Microsoft.Data.SqlClient;

string connectionString = "Server=localhost;Database=SqlPlayground;User Id=sa;Password=yourpassword;";
using var conn = new SqlConnection(connectionString);
using var adapter = new SqlDataAdapter("SELECT * FROM TvShows", conn);

var dataSet = new DataSet();
adapter.Fill(dataSet, "TvShows");

// Access data
foreach (DataRow row in dataSet.Tables["TvShows"].Rows)
{
    Console.WriteLine($"{row["ShowName"]} ({row["Rating"]})");
}
Example: Updating Data with SqlDataAdapter
using System.Data;
using Microsoft.Data.SqlClient;

string connectionString = "Server=localhost;Database=SqlPlayground;User Id=sa;Password=yourpassword;";
using var conn = new SqlConnection(connectionString);
using var adapter = new SqlDataAdapter("SELECT * FROM TvShows", conn);

// Auto-generate commands for update/insert/delete
var builder = new SqlCommandBuilder(adapter);

var dataSet = new DataSet();
adapter.Fill(dataSet, "TvShows");

// Modify data in-memory
var table = dataSet.Tables["TvShows"];
table.Rows[0]["Rating"] = 5.0m;

// Push changes back to the database
adapter.Update(dataSet, "TvShows");
Example: Using SQLiteDataAdapter with SQLite
using System.Data;
using Microsoft.Data.Sqlite;

string connectionString = "Data Source=tvshows.db";
using var conn = new SqliteConnection(connectionString);
using var adapter = new SqliteDataAdapter("SELECT * FROM TvShows", conn);

var dataSet = new DataSet();
adapter.Fill(dataSet, "TvShows");
Notes:
- DataAdapters are best for simple, disconnected scenarios.
- For large-scale or modern applications, consider using ORMs like Dapper or Entity Framework.
- Always dispose connections and adapters properly.
DbTransaction
A DbTransaction represents a database transaction, allowing you to execute multiple operations as a single unit of work. If any operation fails, you can roll back all changes to maintain data integrity.
Example: Using DbTransaction with SQL Server
using System.Data.Common;
using Microsoft.Data.SqlClient;

string connectionString = "Server=localhost;Database=SqlPlayground;User Id=sa;Password=yourpassword;";
using DbConnection conn = new SqlConnection(connectionString);
conn.Open();

using var transaction = conn.BeginTransaction();
try
{
    using var cmd1 = conn.CreateCommand();
    cmd1.Transaction = transaction;
    cmd1.CommandText = "INSERT INTO TvShows (ShowName, ShowLength, Summary, Rating, Episode, ParentalGuide) VALUES (@name, @length, @summary, @rating, @episode, @guide)";
    cmd1.Parameters.Add(new SqlParameter("@name", "New Show"));
    cmd1.Parameters.Add(new SqlParameter("@length", 1200));
    cmd1.Parameters.Add(new SqlParameter("@summary", "A new show summary"));
    cmd1.Parameters.Add(new SqlParameter("@rating", 4.5m));
    cmd1.Parameters.Add(new SqlParameter("@episode", "1x01"));
    cmd1.Parameters.Add(new SqlParameter("@guide", "PG"));
    cmd1.ExecuteNonQuery();

    using var cmd2 = conn.CreateCommand();
    cmd2.Transaction = transaction;
    cmd2.CommandText = "UPDATE TvShows SET Rating = Rating + 0.1 WHERE ShowName = @name";
    cmd2.Parameters.Add(new SqlParameter("@name", "New Show"));
    cmd2.ExecuteNonQuery();

    transaction.Commit();
    Console.WriteLine("Transaction committed.");
}
catch
{
    transaction.Rollback();
    Console.WriteLine("Transaction rolled back.");
}
Example: Using DbTransaction with PostgreSQL
using System.Data.Common;
using Npgsql;

string connectionString = "Host=localhost;Username=postgres;Password=yourpassword;Database=yourdb";
using DbConnection conn = new NpgsqlConnection(connectionString);
conn.Open();

using var transaction = conn.BeginTransaction();
try
{
    using var cmd = conn.CreateCommand();
    cmd.Transaction = transaction;
    cmd.CommandText = "INSERT INTO tv_shows (show_name, rating) VALUES (@name, @rating)";
    cmd.Parameters.Add(new NpgsqlParameter("@name", "Another Show"));
    cmd.Parameters.Add(new NpgsqlParameter("@rating", 4.2m));
    cmd.ExecuteNonQuery();

    transaction.Commit();
}
catch
{
    transaction.Rollback();
}
Example: Using DbTransaction with SQLite
using System.Data.Common;
using Microsoft.Data.Sqlite;

string connectionString = "Data Source=tvshows.db";
using DbConnection conn = new SqliteConnection(connectionString);
conn.Open();

using var transaction = conn.BeginTransaction();
try
{
    using var cmd = conn.CreateCommand();
    cmd.Transaction = transaction;
    cmd.CommandText = "UPDATE TvShows SET Rating = Rating + 0.1 WHERE ShowName = $name";
    cmd.Parameters.AddWithValue("$name", "Friends");
    cmd.ExecuteNonQuery();

    transaction.Commit();
}
catch
{
    transaction.Rollback();
}
Notes:
- Always associate commands with the transaction (
cmd.Transaction = transaction). - Use
Commit()to save changes orRollback()to undo on error. - Transactions help ensure data consistency and integrity.
- For async code, use
BeginTransactionAsync(),CommitAsync(), andRollbackAsync().
ORM - Dapper
dotnet add package Dapper --version 2.0.123
using Microsoft.Data.SqlClient;
using Dapper;

await cn.OpenAsync();
var shows = await cn.QueryAsync<TvShow>("select * from TvShows");

public class TvShow
{
    public long Id {get; init;}
    public string ShowName {get; init;}
    public int ShowLength {get; init;}
    public string Summary {get; init;}
    public decimal Rating {get; init;}
    public string Episode {get; init;}
    public string ParentalGuide {get; init;}
}
ORM - Entity Framework
Entity Framework Core (EF Core) is a modern, open-source, object-database mapper for .NET. It enables developers to work with databases using .NET objects, eliminating most of the data-access code typically required. EF Core supports LINQ queries, change tracking, updates, and schema migrations across multiple database providers.
Example: Basic Usage with a DbContext and Model
using Microsoft.EntityFrameworkCore;

public class TvShow
{
    public int Id { get; set; }
    public string ShowName { get; set; }
    public decimal Rating { get; set; }
}

public class AppDbContext : DbContext
{
    public DbSet<TvShow> TvShows { get; set; }

    protected override void OnConfiguring(DbContextOptionsBuilder options)
        => options.UseSqlServer("YourConnectionStringHere");
}

// Usage
using var db = new AppDbContext();
db.TvShows.Add(new TvShow { ShowName = "Friends", Rating = 4.8m });
db.SaveChanges();

var highRated = db.TvShows.Where(t => t.Rating > 4.0m).ToList();
Entity Framework: Raw SQL Queries with FromSql and FromSqlInterpolated
Entity Framework Core allows you to execute SQL queries using the FromSql and FromSqlInterpolated methods. These methods are safe against SQL injection because they always treat parameter values as SQL parameters, not as part of the SQL command text.
Example: Using FromSql with Parameters
using Microsoft.EntityFrameworkCore;

var minRating = 4.0m;
var shows = db.TvShows
    .FromSql($"SELECT * FROM TvShows WHERE Rating > {minRating}")
    .ToList();
Example: Using FromSqlInterpolated
var showName = "Friends";
var result = db.TvShows
    .FromSqlInterpolated($"SELECT * FROM TvShows WHERE ShowName = {showName}")
    .ToList();
Note:
- These methods can only be used on queries that return entity types (not arbitrary projections).
For more details, see the official documentation.
Entity Framework Core: Disabling Change Tracking
By default, EF Core tracks changes to entities for automatic updates. For read-only scenarios, you can disable change tracking to improve performance using .AsNoTracking().
Example:
using Microsoft.EntityFrameworkCore;

public class TvShow
{
    public int Id { get; set; }
    public string ShowName { get; set; }
    public decimal Rating { get; set; }
}

public class AppDbContext : DbContext
{
    public DbSet<TvShow> TvShows { get; set; }

    protected override void OnConfiguring(DbContextOptionsBuilder options)
        => options.UseSqlServer("YourConnectionStringHere");
}

// Usage: Query with change tracking disabled
using var db = new AppDbContext();
var shows = db.TvShows
    .AsNoTracking()
    .Where(t => t.Rating > 4.0m)
    .ToList();
Use .AsNoTracking() for queries where you do not intend to update the returned entities.
Database Migrations - Entity Framework Core
Entity Framework Core supports code-based migrations to evolve your database schema alongside your models. Migrations are tracked in code and can be applied to the database as needed.
1. Add EF Core Tools
Install the EF Core CLI tools if not already present:
dotnet tool install --global dotnet-ef
Add the EF Core packages to your project:
dotnet add package Microsoft.EntityFrameworkCore
dotnet add package Microsoft.EntityFrameworkCore.Design
2. Create a Migration
After defining or updating your DbContext and models, create a migration:
dotnet ef migrations add InitialCreate
This generates a migration file in the Migrations folder.
3. Apply the Migration
Update the database to apply the migration:
dotnet ef database update
4. Example Migration Class
A generated migration might look like:
public partial class InitialCreate : Migration
{
    protected override void Up(MigrationBuilder migrationBuilder)
    {
        migrationBuilder.CreateTable(
            name: "TvShows",
            columns: table => new
            {
                Id = table.Column<int>(nullable: false)
                    .Annotation("SqlServer:Identity", "1, 1"),
                ShowName = table.Column<string>(nullable: false),
                Rating = table.Column<decimal>(type: "decimal(18,2)", nullable: false)
            },
            constraints: table =>
            {
                table.PrimaryKey("PK_TvShows", x => x.Id);
            });
    }

    protected override void Down(MigrationBuilder migrationBuilder)
    {
        migrationBuilder.DropTable(name: "TvShows");
    }
}
5. Further Changes
To modify the schema, update your models and repeat the dotnet ef migrations add and dotnet ef database update steps.
For more, see the official EF Core migrations documentation.
Database Migration - FluentMigrator
FluentMigrator is a migration framework for .NET that enables you to define database schema changes in C# using a fluent, expressive API. It supports versioned migrations, rollbacks, and can execute both fluent and raw SQL commands.
Example: Creating a Table with Fluent Syntax
using FluentMigrator;

[Migration(2023040701)]
public class CreateTvShowsTable : Migration
{
    public override void Up()
    {
        Create.Table("TvShows")
            .WithColumn("Id").AsInt64().PrimaryKey().Identity()
            .WithColumn("ShowName").AsString(50).NotNullable()
            .WithColumn("ShowLength").AsInt32().NotNullable()
            .WithColumn("Rating").AsDecimal(18,2).Nullable();
    }

    public override void Down()
    {
        Delete.Table("TvShows");
    }
}
Example: Executing Raw SQL in a Migration
using FluentMigrator;

[Migration(2023040702)]
public class InsertSampleData : Migration
{
    public override void Up()
    {
        Execute.Sql("INSERT INTO TvShows (ShowName, ShowLength, Rating) VALUES ('Friends', 1380, 4.8)");
    }

    public override void Down()
    {
        Execute.Sql("DELETE FROM TvShows WHERE ShowName = 'Friends'");
    }
}
Running Migrations
To run migrations, use the FluentMigrator CLI or integrate it into your build pipeline:
dotnet tool install -g FluentMigrator.DotNet.Cli

fluentmigrator migrate --assembly path/to/Your.Migrations.dll --provider sqlserver --connection "Server=.;Database=YourDb;Trusted_Connection=True;"
Transactions and Isolation Levels
Transaction isolation levels determine how and when the changes made by one transaction become visible to other concurrent transactions. They help balance data consistency with system performance and concurrency.
Common Isolation Levels
| Isolation Level | Dirty Reads | Non-Repeatable Reads | Phantom Reads | Supported By |
|---|---|---|---|---|
| Read Uncommitted | Yes | Yes | Yes | SQL Server, SQLite |
| Read Committed | No | Yes | Yes | SQL Server, PostgreSQL, SQLite* |
| Repeatable Read | No | No | Yes | SQL Server, PostgreSQL |
| Serializable | No | No | No | SQL Server, PostgreSQL, SQLite |
| Snapshot | No | No | No* | SQL Server, PostgreSQL† |
* SQLite uses a simplified model; see notes below.
† PostgreSQL implements snapshot isolation as its default for REPEATABLE READ.
Isolation Level Descriptions
- Read Uncommitted: Allows reading uncommitted changes (“dirty reads”) from other transactions. Fastest, but least safe.
- Read Committed: Only reads data that has been committed. Prevents dirty reads, but non-repeatable and phantom reads are possible. Default in SQL Server and PostgreSQL.
- Repeatable Read: Ensures that if a row is read twice in the same transaction, it will not change. Prevents dirty and non-repeatable reads, but phantom reads can still occur.
- Serializable: Highest isolation; transactions are completely isolated from each other. Prevents dirty, non-repeatable, and phantom reads. May reduce concurrency.
- Snapshot: Each transaction sees a snapshot of the data as it was at the start of the transaction. Prevents dirty and non-repeatable reads, and usually phantom reads.
Example: Setting Isolation Level in SQL
SQL Server:
SET TRANSACTION ISOLATION LEVEL REPEATABLE READ;
BEGIN TRANSACTION;

SELECT * FROM TvShows WHERE Rating > 4.0;

-- ... do work ...

COMMIT TRANSACTION;
PostgreSQL:
BEGIN TRANSACTION ISOLATION LEVEL SERIALIZABLE;

SELECT * FROM tv_shows WHERE rating > 4.0;

-- ... do work ...

COMMIT;
SQLite:
SQLite supports DEFERRED, IMMEDIATE, and EXCLUSIVE transactions, but you can simulate isolation levels:
BEGIN IMMEDIATE TRANSACTION;

SELECT * FROM TvShows WHERE Rating > 4.0;

-- ... do work ...

COMMIT;
- By default, SQLite is closest to SERIALIZABLE, but with some caveats due to its file-based locking.
Example: Setting Isolation Level in C#
SQL Server:
using (var conn = new SqlConnection(connectionString))
{
    conn.Open();
    using (var tran = conn.BeginTransaction(System.Data.IsolationLevel.Serializable))
    {
        // All commands here use the specified isolation level
        // ...
        tran.Commit();
    }
}
PostgreSQL:
using (var conn = new NpgsqlConnection(connectionString))
{
    conn.Open();
    using (var tran = conn.BeginTransaction(System.Data.IsolationLevel.RepeatableRead))
    {
        // All commands here use the specified isolation level
        // ...
        tran.Commit();
    }
}
SQLite:
using (var conn = new SqliteConnection(connectionString))
{
    conn.Open();
    using (var tran = conn.BeginTransaction(System.Data.IsolationLevel.Serializable))
    {
        // All commands here use the specified isolation level
        // ...
        tran.Commit();
    }
}
Note: SQLite only supports
SerializableandRead Uncommittedisolation levels.Read Committedis emulated by default.
Summary Table
| Isolation Level | Dirty Reads | Non-Repeatable Reads | Phantom Reads | SQL Server | PostgreSQL | SQLite |
|---|---|---|---|---|---|---|
| Read Uncommitted | Yes | Yes | Yes | Yes | No | Yes |
| Read Committed | No | Yes | Yes | Yes | Yes* | Emulated |
| Repeatable Read | No | No | Yes | Yes | Yes | No |
| Serializable | No | No | No | Yes | Yes | Yes |
| Snapshot | No | No | No* | Yes | Yes† | No |
* PostgreSQL’s default is Read Committed, but its Repeatable Read is implemented as snapshot isolation.
† PostgreSQL’s Repeatable Read is snapshot isolation; true Serializable is stricter.
Tip: Choose the lowest isolation level that meets your consistency requirements to maximize performance and concurrency.
SQL Database Backup
Use SqlConnection and SqlCommand to create a bak copy only backup of a database.
using Microsoft.Data.SqlClient;

public async Task Backup(string connection, string saveFile,
    TimeSpan timout)
{
    string backupDir = System.IO.Path.GetDirectoryName(saveFile);
    if (System.IO.Directory.Exists(backupDir) == false)
    {
        System.IO.Directory.CreateDirectory(backupDir);
    }

    if (System.IO.File.Exists(saveFile)){
        System.IO.File.Delete(saveFile);
    }

    var csb = new SqlConnectionStringBuilder(connection);
    string database = csb.InitialCatalog;

    var sql = $@"
        BACKUP DATABASE [{database}]
        TO DISK = '{saveFile}'
        WITH FORMAT, COMPRESSION,
             MEDIANAME = '{database}-Data',
             NAME = 'Full Backup of {database}',
             COPY_ONLY;
    ";

    using var cn = new SqlConnection(connection);
    using var cmd = new SqlCommand();

    cmd.CommandTimeout = timeout.TotalMinutes;
    await cn.OpenAsync();
    cmd.CommandText = sql;
    cmd.Connection = cn;

    await cmd.ExecuteNonQueryAsync();
}
ASP.Net Core
Dependency Injection
MVC
Minimal API
Blazor
Containers - Docker
A Docker container is a lightweight, portable, and self-sufficient unit that packages an application and all its dependencies, ensuring consistent execution across different environments. Containers are isolated from each other and the host system, making deployment and scaling straightforward.
Example: Dockerfile for a .NET Web Application
# Use the official .NET SDK image for build
FROM mcr.microsoft.com/dotnet/sdk:8.0 AS build
WORKDIR /src
COPY . .
RUN dotnet publish -c Release -o /app --no-restore

# Use the ASP.NET runtime image for hosting
FROM mcr.microsoft.com/dotnet/aspnet:8.0 AS runtime
WORKDIR /app
COPY --from=build /app ./
EXPOSE 80
ENTRYPOINT ["dotnet", "YourWebApp.dll"]
Build and Publish with Docker Buildx and SBOM
one time setup
docker buildx create --use --name=buildkit-container --driver=docker-container
regular builds
# Build the image with SBOM (Software Bill of Materials) generation
docker buildx build --sbom=true -t yourusername/yourwebapp:latest .

# Publish (push) the image to a container registry (e.g., Docker Hub)
docker push yourusername/yourwebapp:latest
The --sbom=true flag generates a Software Bill of Materials, providing transparency into the components included in the image for improved security and compliance.
nginx
Javascript
JavaScript is a lightweight, interpreted programming language primarily used for client-side web development. It enables dynamic content, user interaction, and DOM manipulation in browsers. This guide focuses on plain JavaScript for frontend tasks, avoiding dependencies and TypeScript for simplicity and maintainability.
Use htmx to Avoid Complicated JavaScript
Use htmx when you want to add dynamic, interactive features to your web application without writing or maintaining large amounts of custom JavaScript.
htmx gives you access to AJAX, CSS Transitions, WebSockets and Server Sent Events directly in HTML, using attributes, so you can build modern user interfaces with the simplicity and power of hypertext
fetch
Call a service using post with fetch api. These examples uses helper functions that are defined in the Helper functions sub section below.
call fetch - form-urlencoded
Use a custom serialize helper method to transform an javascript object (json) to an form url encoded format.
Example:
?test_param=test value&another_param=another value
function PostFormUrlEncoded(msg) {
    var data = serialize({
        test_param: "test value",
        another_param: "another value",
    });

    return fetch(site + "/some/url", {
        method: "POST",
        mode: "cors",
        headers: {
            "Content-Type": "application/x-www-form-urlencoded",
        },
        body: data,
    });
}

PostFormUrlEncoded("My comment")
    .then(status_helper)
    .then(json_helper)
    .then(function (data) {
        console.log(data);
    })
    .catch(function (error) {
        console.log(error);
    });
call fetch - application/json
The content type application/json can use the builtin method JSON.stringify to send data.
const site = "https://example.com"; // Define your site URL

function PostJson(msg) {
  var data = JSON.stringify({
    test_param: "test value",
    another_param: "another value",
  });

  return fetch(site + "/some/url", {
    method: "POST",
    mode: "cors",
    headers: {
      "Content-Type": "application/json",
    },
    body: data,
  });
}

PostJson("My comment")
  .then(status_helper)
  .then(json_helper)
  .then(function (data) {
    console.log(data);
  })
  .catch(function (error) {
    console.log(error);
  });
Helper functions
These helper functions implement some boiler plate code that will almost always be needed.
function status_helper(response) {
  if (response.status >= 200 && response.status < 300) {
    return Promise.resolve(response);
  } else {
    return Promise.reject(new Error(response.statusText));
  }
}

function json_helper(response) {
  return response.json();
}

function serialize(obj, prefix) {
  if (prefix === void 0) {
    prefix = null;
  }
  var str = [],
    p;
  for (p in obj) {
    if (Object.prototype.hasOwnProperty.call(obj, p)) {
      var k = prefix ? prefix + "[" + p + "]" : p,
        v = obj[p];
      str.push(
        v !== null && typeof v === "object"
          ? serialize(v, k)
          : encodeURIComponent(k) + "=" + encodeURIComponent(v)
      );
    }
  }
  return str.join("&");
}
async/await
Async and await support is built upon javascript promises. The following example is a slight modification on the PostJson example
Notice how the DownloadPage function is a GET and does not have a mode, headers, or body. A body must not be set on a GET but the other properties are setable. DownloadPage returns the response.text().
In contrast the PostJson function is a POST and sets the mode to cors, headers, and a body. PostJson returns the response.json().
async function DownloadPage(url) {
  const response = await fetch(url, {
    method: "GET",
  });

  if (response.status < 200 || response.status > 299) {
    throw new Error(response.status);
  }

  return response.text();
}

async function PostJson(url, msg) {
  var data = JSON.stringify({
    test_param: "test value",
    another_param: "another value",
  });

  const response = await fetch(url, {
    method: "POST",
    mode: "cors",
    headers: {
      "Content-Type": "application/json",
    },
    body: data,
  });

  if (response.status < 200 || response.status > 299) {
    throw new Error(response.status);
  }

  return response.json();
}

PostJson("https://majorsilence.com/non/existing/post/page", "My comment")
  .then(function (data) {
    console.log(data);
  })
  .catch(function (error) {
    console.log(error);
  });

DownloadPage("https://majorsilence.com")
  .then(function (data) {
    console.log(data);
  })
  .catch(function (error) {
    console.log(error);
  });
jQuery
Avoid for new work.
Kendo UI
Avoid unless advanced controls are required.
Microsoft Maui
Monitoring Environments and Services (SRE/DevOps)
Effective monitoring is essential for Site Reliability Engineering (SRE) and DevOps teams to ensure the health, performance, and reliability of applications and infrastructure. Modern monitoring solutions provide real-time visibility, alerting, and analytics for both system-level and application-level metrics.
Prometheus Ecosystem
Prometheus is a leading open-source monitoring and alerting toolkit designed for reliability and scalability. It excels at collecting time-series metrics from targets via HTTP endpoints, supports flexible queries, and integrates seamlessly with cloud-native environments.
Key Features
- Metrics Collection: Scrapes metrics from applications, services, and infrastructure.
- OpenTelemetry Support: Integrates with OpenTelemetry for standardized observability data (metrics, traces, logs).
- Blackbox Exporter: Performs external health checks (HTTP, TCP, ICMP) to monitor service availability from the outside.
- Alerting: Built-in alert manager for notifications based on custom rules.
Service Discovery
Prometheus uses service discovery to automatically find and monitor targets (applications, services, or infrastructure) without manual configuration. This enables dynamic environments—such as Kubernetes, cloud platforms, or virtual machines—to be monitored as they scale up or down. Prometheus supports various service discovery mechanisms, including static configuration, DNS, file-based discovery, and integrations with cloud providers and orchestration systems.
Exporters are lightweight services that expose metrics from third-party systems (like databases, hardware, or messaging queues) in a format Prometheus can scrape. There are many official and community-supported exporters for popular technologies (e.g., node_exporter for system metrics, blackbox_exporter for endpoint probing, mysqld_exporter for MySQL).
Integrations refer to the broad ecosystem of tools and exporters that allow Prometheus to collect metrics from virtually any system, making it highly extensible and adaptable to diverse monitoring needs.
- Prometheus Configuration
- Exporters and integrations
- https://prometheus.io/docs/prometheus/latest/http_sd/
- custom targets SD
- https://prometheus.io/docs/guides/file-sd/
- custom targets SD
Example: Exposing Metrics in .NET
Add the prometheus-net NuGet package to your ASP.NET Core app:
using Prometheus;

app.UseMetricServer(); // Exposes /metrics endpoint
app.UseHttpMetrics();  // Collects HTTP request metrics
Prometheus can then scrape metrics from http://your-service/metrics.
Example: Blackbox Exporter Configuration
Monitor an external HTTP endpoint:
# prometheus.yml
scrape_configs:
    - job_name: 'blackbox'
        metrics_path: /probe
        params:
            module: [http_2xx]
        static_configs:
            - targets:
                - https://your-service.example.com
        relabel_configs:
            - source_labels: [__address__]
                target_label: __param_target
            - target_label: __address__
                replacement: blackbox-exporter:9115
Grafana for Visualization
Grafana is a powerful open-source analytics and monitoring platform. It connects to Prometheus and other data sources to create interactive dashboards, visualizations, and alerts.
Ready to use dashboards for prometheus can be downloaded from Grafana dashboards page.
Example: Prometheus Data Source in Grafana
- Add Prometheus as a data source in Grafana (URL:
http://prometheus:9090). -
Create dashboards using queries like:
http_requests_total{job="myapp"} up{job="blackbox"} - Set up alerts for key metrics (e.g., service downtime, high latency).
Kubernetes
# use multiple kubeconfig files at the same time and view merged config
KUBECONFIG=~/.kube/config:~/.kube/kubconfig2
kubectl config view
kubectl config get-contexts
kubectl config current-context
kubectl get nodes
kubectl get namespaces
kubectl -n theNamespace get all
kubectl -n theNamespace get pods
kubectl -n theNamespace get deployments
kubectl -n theNamespace get service
kubectl -n theNamespace get ingress
kubectl -n theNamespace describe deployment theDeployment

# create a new pod yaml file.  Edit the pod.yaml file to your needs.
kubectl run nginx --image=nginx --dry-run=client -o yaml > pod.yaml
kubectl create -f pod.yaml
Further reading:
Build Pipelines
Build pipelines are automated workflows that compile, test, and deploy code changes systematically. They ensure code quality, streamline development, and enhance reliability, integrating tasks like testing, deployment, and monitoring, resulting in efficient, error-free software delivery.
GitHub Actions
GitHub actions should go in the .github/workflows directory of a git project. The file type is yml but the name can be anything.
Example dotnet github action named dotnet.yml. This GitHub action builds a self contained dotnet console application, run tests, publishes the tests, and zips and archives the output artifacts for Windows, Linux, and Mac.
name: .NET

on:
  push:
    branches: [main]
  pull_request:
    branches: [main]

jobs:
  linux-build:
    runs-on: ubuntu-latest
    steps:
      - uses: actions/checkout@v4
      - name: Setup .NET
        uses: actions/setup-dotnet@v4
        with:
          dotnet-version: 8.0.x
      - name: Restore dependencies
        run: dotnet restore [YourSolution].sln
      - name: Build
        run: dotnet build [YourSolution].sln --no-restore -c Release
      - name: Test
        run: dotnet test -c Release [YourSolution].sln --verbosity normal --collect:"XPlat Code Coverage" --logger:"trx"
      - name: Test Report Publish
        uses: dorny/test-reporter@v2
        if: success() || failure() # run this step even if previous step failed
        with:
          name: unit tests
          path: "**/TestResults/*.trx"
          reporter: dotnet-trx
      - name: Publish
        run: dotnet publish [YourProject] -c Release -r linux-x64 -p:PublishReadyToRun=true --self-contained true -p:PublishSingleFile=true -p:EnableCompressionInSingleFile=true
      - name: Archive artifacts
        uses: actions/upload-artifact@v4
        with:
          name: [YourProject]-linux-x64
          path: |
            [YourProject]/bin/Release/net8.0/linux-x64
          retention-days: 1

  windows-build:
    runs-on: windows-latest
    steps:
      - uses: actions/checkout@v4
      - name: Setup .NET
        uses: actions/setup-dotnet@v4
        with:
          dotnet-version: 8.0.x
      - name: Restore dependencies
        run: dotnet restore [YourSolution].sln
      - name: Build
        run: dotnet build [YourSolution].sln --no-restore -c Release
      - name: Publish
        run: dotnet publish [YourProject] -c Release -r win-x64 -p:PublishReadyToRun=true --self-contained true -p:PublishSingleFile=true -p:EnableCompressionInSingleFile=true
      - name: Archive artifacts
        uses: actions/upload-artifact@v4
        with:
          name: [YourProject]-win-x64
          path: |
            [YourProject]/bin/Release/net8.0/win-x64
          retention-days: 1

  mac-build:
    runs-on: macos-latest
    steps:
      - uses: actions/checkout@v4
      - name: Setup .NET
        uses: actions/setup-dotnet@v4
        with:
          dotnet-version: 8.0.x
      - name: Restore dependencies
        run: dotnet restore [YourSolution].sln
      - name: Build
        run: dotnet build [YourSolution].sln --no-restore -c Release
      - name: Publish
        run: dotnet publish [YourProject] -c Release -r osx-x64 -p:PublishReadyToRun=true --self-contained true -p:PublishSingleFile=true -p:EnableCompressionInSingleFile=true
      - name: Archive artifacts
        uses: actions/upload-artifact@v4
        with:
          name: [YourProject]-osx-x64
          path: |
            [YourProject]/bin/Release/net8.0/osx-x64
          retention-days: 1
GH Action to Create Linux Packages
jobs:
  linux-build:
    runs-on: ubuntu-latest
    env:
      SOLUTION_NAME: "YourSolution"
      DEVELOPER: "majorsilence"
      PROJECT: "Your Project"
      MAIN_EXE: "The Main Exe filename"
      PRODUCT: "product name"
      MAINTAINER: "Your Name <your@example.com>"
      VERSION: "1.0.0"
    steps:
    - uses: actions/checkout@v4
    - name: Setup .NET
      uses: actions/setup-dotnet@v4
      with:
        dotnet-version: 8.0.x
    - name: Build
      run: |
        dotnet restore $.sln
        dotnet build -c Release $.sln --no-restore
        dotnet publish -c Release -r linux-x64 --self-contained true
    - name: Prep for fpm
      run: |
        mkdir -p build/linux/opt/$/$
        cp -r $/bin/Release/net8.0/linux-x64/publish/* build/linux/opt/$/$/
        chmod +x build/linux/opt/$/$/$
        mkdir -p build/linux/usr/bin
        cat > build/linux/usr/bin/$-$ << 'EOF'
        #!/bin/sh
        /opt/$/$/$ "$@"
        rc=$?
        exit $rc
        EOF
        chmod +x build/linux/usr/bin/$-$
    - name: Build deb package
      run: |
        cd build/linux
        fpm -s dir -t deb \
        --name $-$ \
        --version $ \
        --description "$ $ tool." \
        --maintainer "$" \
        --license "MIT" \
        --architecture all \
        --deb-no-default-config-files \
        --url "https://github.com/$/$" \
        --maintainer "$" \
        ./
Jenkins
Find jenkins installation instructions at https://www.jenkins.io/download/.
Ubuntu Jenkins install
curl -fsSL https://pkg.jenkins.io/debian-stable/jenkins.io.key | sudo tee \
    /usr/share/keyrings/jenkins-keyring.asc > /dev/null

echo deb [signed-by=/usr/share/keyrings/jenkins-keyring.asc] \
    https://pkg.jenkins.io/debian-stable binary/ | sudo tee \
    /etc/apt/sources.list.d/jenkins.list > /dev/null

sudo apt-get update
sudo apt-get install jenkins openjdk-21-jdk-headless docker.io -y
sudo usermod -a -G docker jenkins


# java -jar jenkins-cli.jar -s http://localhost:8080/ install-plugin SOURCE ... [-deploy] [-name VAL] [-restart]
Jenkins Plugin Setup
Install the docker pipelines and git branch source plugins
- https://plugins.jenkins.io/docker-workflow/
- https://plugins.jenkins.io/github-branch-source/
- If github is being used
To display test results various Jenkin plugins are required.
Jenkins Dotnet Pipeline
Example of building and testing a dotnet project that has nunit testing enabled. If there is only one solution in the directory then the solution name does not need to be specified.
Save this file as Jenkinsfile in the projects base folder.
pipeline {
    agent none
    environment {
        DOTNET_CLI_HOME = "/tmp/DOTNET_CLI_HOME"
    }
    stages {
        stage('build and test') {
            agent {
                docker {
                    image 'mcr.microsoft.com/dotnet/sdk:8.0'
                }
            }
            steps {
                echo "building"
                sh """
                dotnet restore [YourSolution].sln
                dotnet build [YourSolution].sln --no-restore
                dotnet test [YourSolution].sln --logger:"nunit"
                # for code coverage run the next line instead of the previous line
                # dotnet test -c Release [YourSolution].sln --collect:"XPlat Code Coverage" --logger:"nunit"
                """
            }
            post{
                always {
                    nunit testResultsPattern: '**/TestResults/*.xml'
                    recordCoverage(tools: [[parser: 'COBERTURA', pattern: '**/TestResults/**/*cobertura.xml']])
                }
            }
        }
    }
}
See Jenkins and pipelines, Jenkinfile for more examples.